Search This Blog

Sunday, January 22, 2023

At least 10 dead in a mass shooting in Monterey Park, Cal.


Tactical team is searching the van from the Torrance standoff
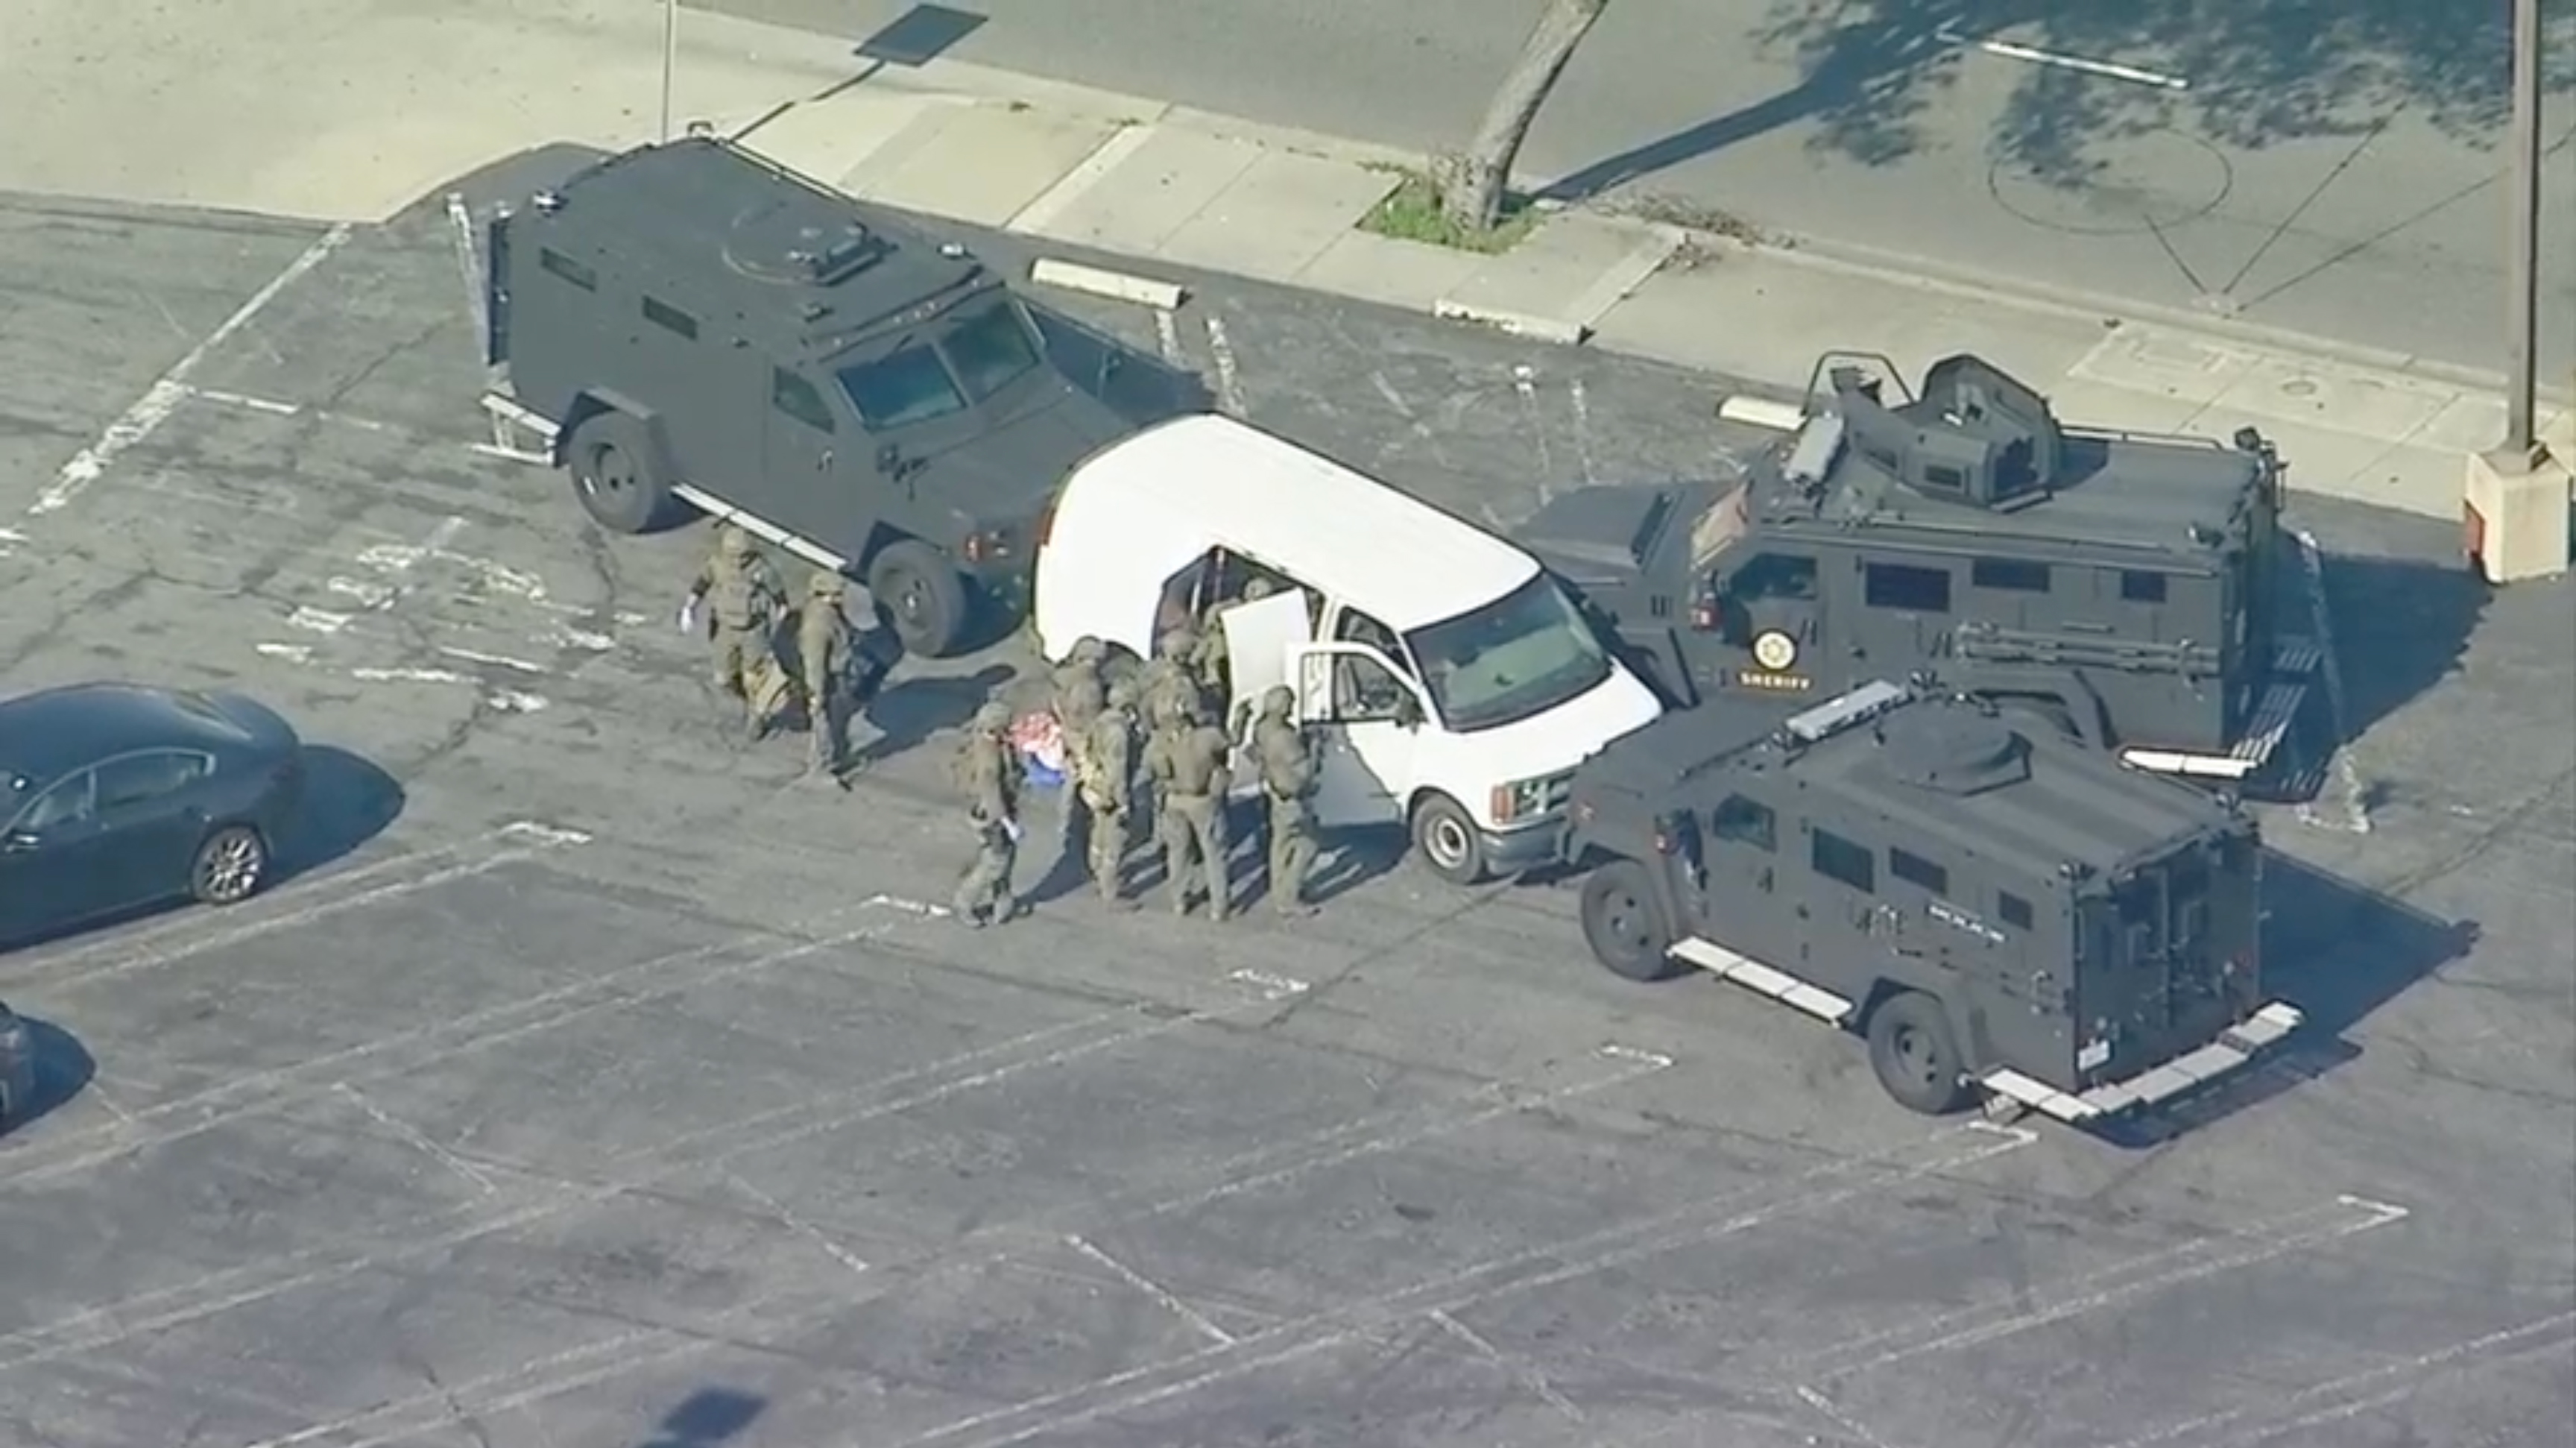
A tactical team searches a white cargo van during a standoff with officers in Torrance, California on Sunday.
A tactical team searches a white cargo van during a standoff with officers in Torrance, California on Sunday. (KABC)

A law enforcement tactical team has moved in and started searching a white cargo van that was involved in a standoff with officers in Torrance, California.

Aerial video from CNN affiliate KABC showed officers approaching the van with rifles drawn. One officer was seen breaking the passenger side window, then reaching inside and opening the door. Officers then opened the side doors and started searching the vehicle.

Law enforcement sources earlier told CNN that the van is potentially linked to the Monterey Park mass shooting. Officers heard what they believed was the sound of the driver shooting himself during a standoff that started after officers pulled the van over, the sources said.

Asked about the standoff, which was still ongoing as Los Angeles County Sheriff Robert Luna held a news conference Sunday afternoon, the sheriff said he didn't yet know if the person in the van was the suspect in Saturday's mass shooting at a dance studio.

Torrance is a city in Los Angeles County's South Bay region, located about 30 miles southwest of Monterey Park.

Sheriff explains why his department has not yet released suspect's name

While law enforcement officials have released a photo of the suspect in the Monterey Park, California, mass shooting, the Los Angeles County sheriff declined to publicly name him at a news conference Sunday afternoon.

Asked by reporters why he was not sharing the man's name, Sheriff Robert Luna said:

"It is a priority to apprehend this person. And we have a lot of resources throughout this entire region, and we believe if we are putting his name out, that will inhibit our ability to potentially arrest the suspect if he's out there — or maybe flee."

"Please be patient with us," Luna continued. "We're going to keep our word that we're going to continuously update you. Because the community, I understand, they're thirsty for information."

Luna said the photo was released because, "from a public safety perspective, we want people to see who this is, and then give us any information that they may have about his whereabouts."

Sheriff says community center will offer resources for victims and their families
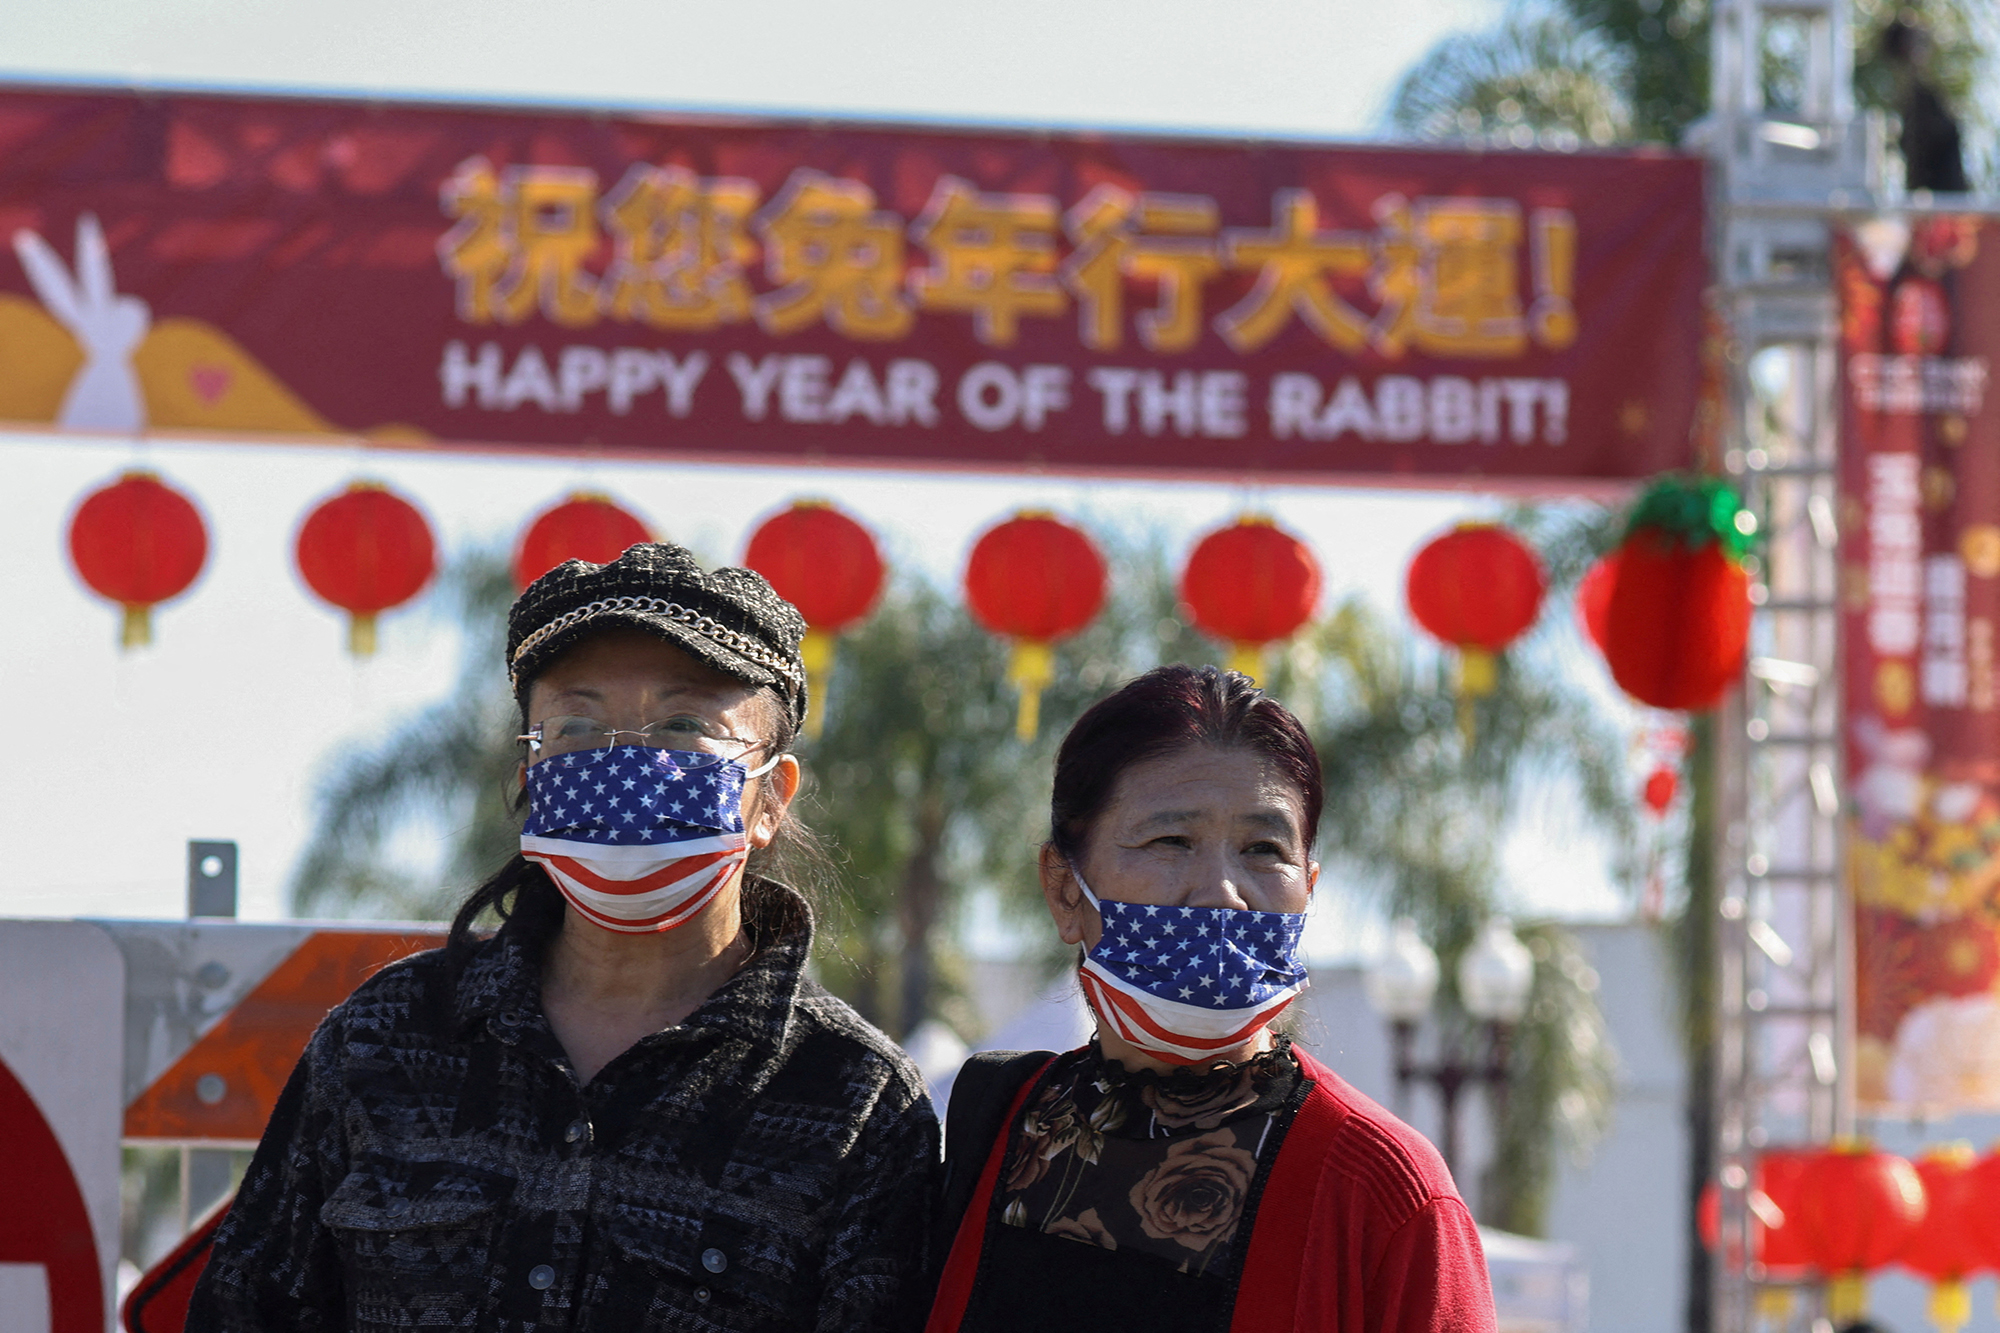
People look at the scene near the shooting in Monterey Park, California, Sunday.
People look at the scene near the shooting in Monterey Park, California, Sunday. (Mike Blake/Reuters)

Los Angeles County Sheriff Robert Luna offered support for survivors and the families of the victims in the Monterey Park mass shooting during a news conference Sunday afternoon.

Luna said a victim resource center has been established at the community's Langley Senior Center.

"As we're looking for the suspect, we will not forget the victims and survivors," Luna told reporters.

He said that workers at the resource center can help anyone still trying to reunify with a loved one who was at the dance studio where the shooting took place, and that psychological services will be offered.

Sheriff: We don't know if driver in Torrance standoff is Monterey Park shooter
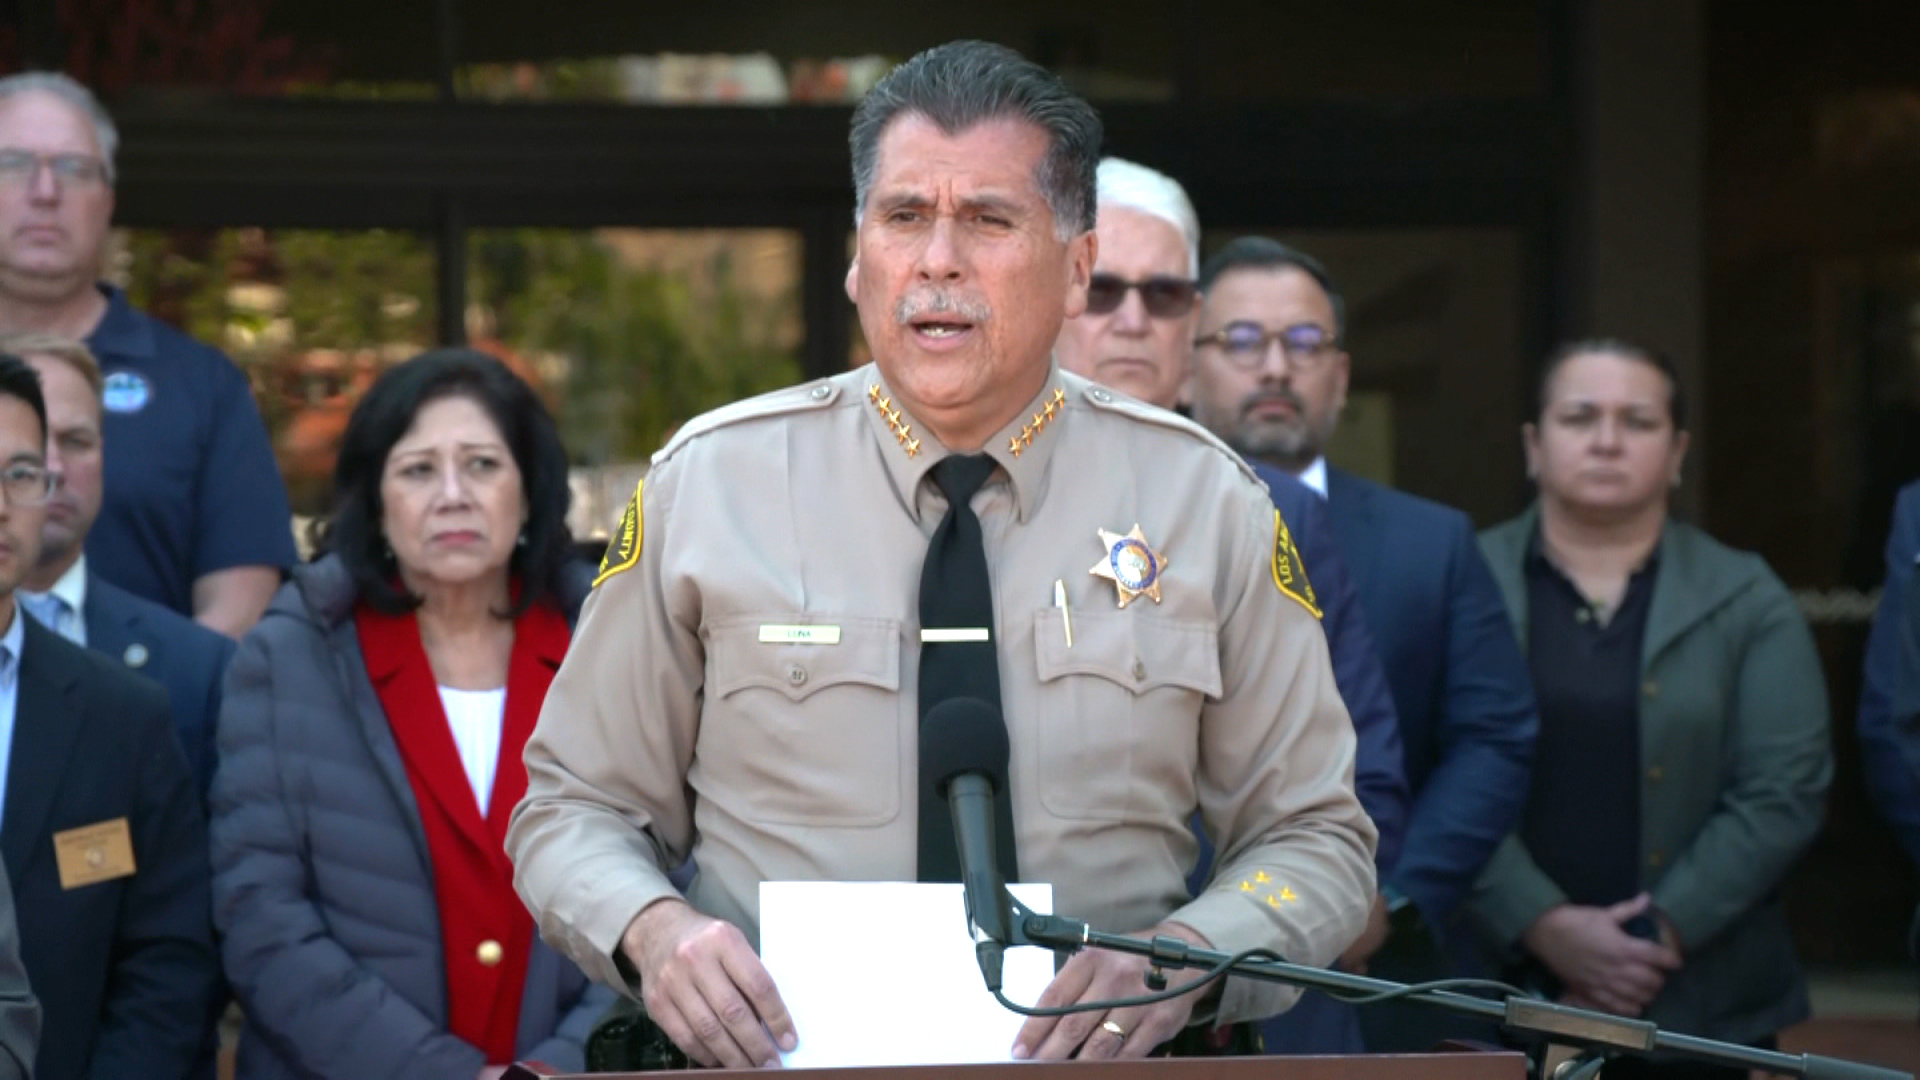
Los Angeles County Sheriff Robert Luna speaks at a press conference about the shooting in Monterey Park, California on Sunday.
Los Angeles County Sheriff Robert Luna speaks at a press conference about the shooting in Monterey Park, California on Sunday. (CNN)

Authorities don't know if a driver of a cargo van involved in a standoff situation in Torrance, California, is linked to the Monterey Park mass shooting, Los Angeles County Sheriff Robert Luna said.

"I want to address also that there is a tactical incident, that is occurring in the city of Torrance, that is being covered. People have asked, 'Is that your suspect?' We don't know," Luna said during a news conference.

He continued, "As I said earlier, today, we had a vehicle that was described as a white box van, I guess you would say, a van of interest. And there is a van that looks just like what was described to us in the city of Torrance. It is a barricaded suspect situation, we are working with one of our partner agencies in the Torrance Police Department to resolve that. We believe there is a person inside of that vehicle. We don't know what their condition is but we will handle that in the safest manner that we possibly can."

Luna went on to say that the driver of the white cargo van could possibly be the shooting suspect, "but at this point, if we are doing our jobs correctly, we are not only looking at that situation or scenario, but we are making sure that we are looking at any and every possibility."

He asked and encouraged community members if they have any information on the shooting suspect to please come forward.

The sheriff's office released photos of the shooting suspect earlier today on social media.

Police say driver of cargo van involved in Torrance standoff may have shot himself

From CNN's John Miller

The standoff in Torrance, California, began when police tried to stop a white cargo van that fit the description of a vehicle of interest from the Saturday night shooting in Monterey Park, law enforcement sources tell CNN, citing preliminary information.

As officers gave commands for the occupant to exit the van, they heard what they believe was the sound of the driver shooting himself, the sources said.

Officers have surrounded the van, and it appears they may be moving toward a tactical approach to ensure the driver is not still alive and armed inside.

Torrance is a city in Los Angeles County's South Bay region, located about 30 miles southwest of Monterey Park.

Sheriff releases photos of mass shooting suspect 

The released images of the mass shooting suspect from the Los Angeles County Sheriff's office.
The released images of the mass shooting suspect from the Los Angeles County Sheriff's office. (LASD)

The Los Angeles County Sheriff's Department has released photos of the suspect in the Monterey Park mass shooting.

Sheriff Robert Luna tweeted photos of the man and noted that investigators identified him as a homicide suspect who should be considered "armed and dangerous."

View the tweet:

From CNN’s Josh Campbell and Paul P. Murphy
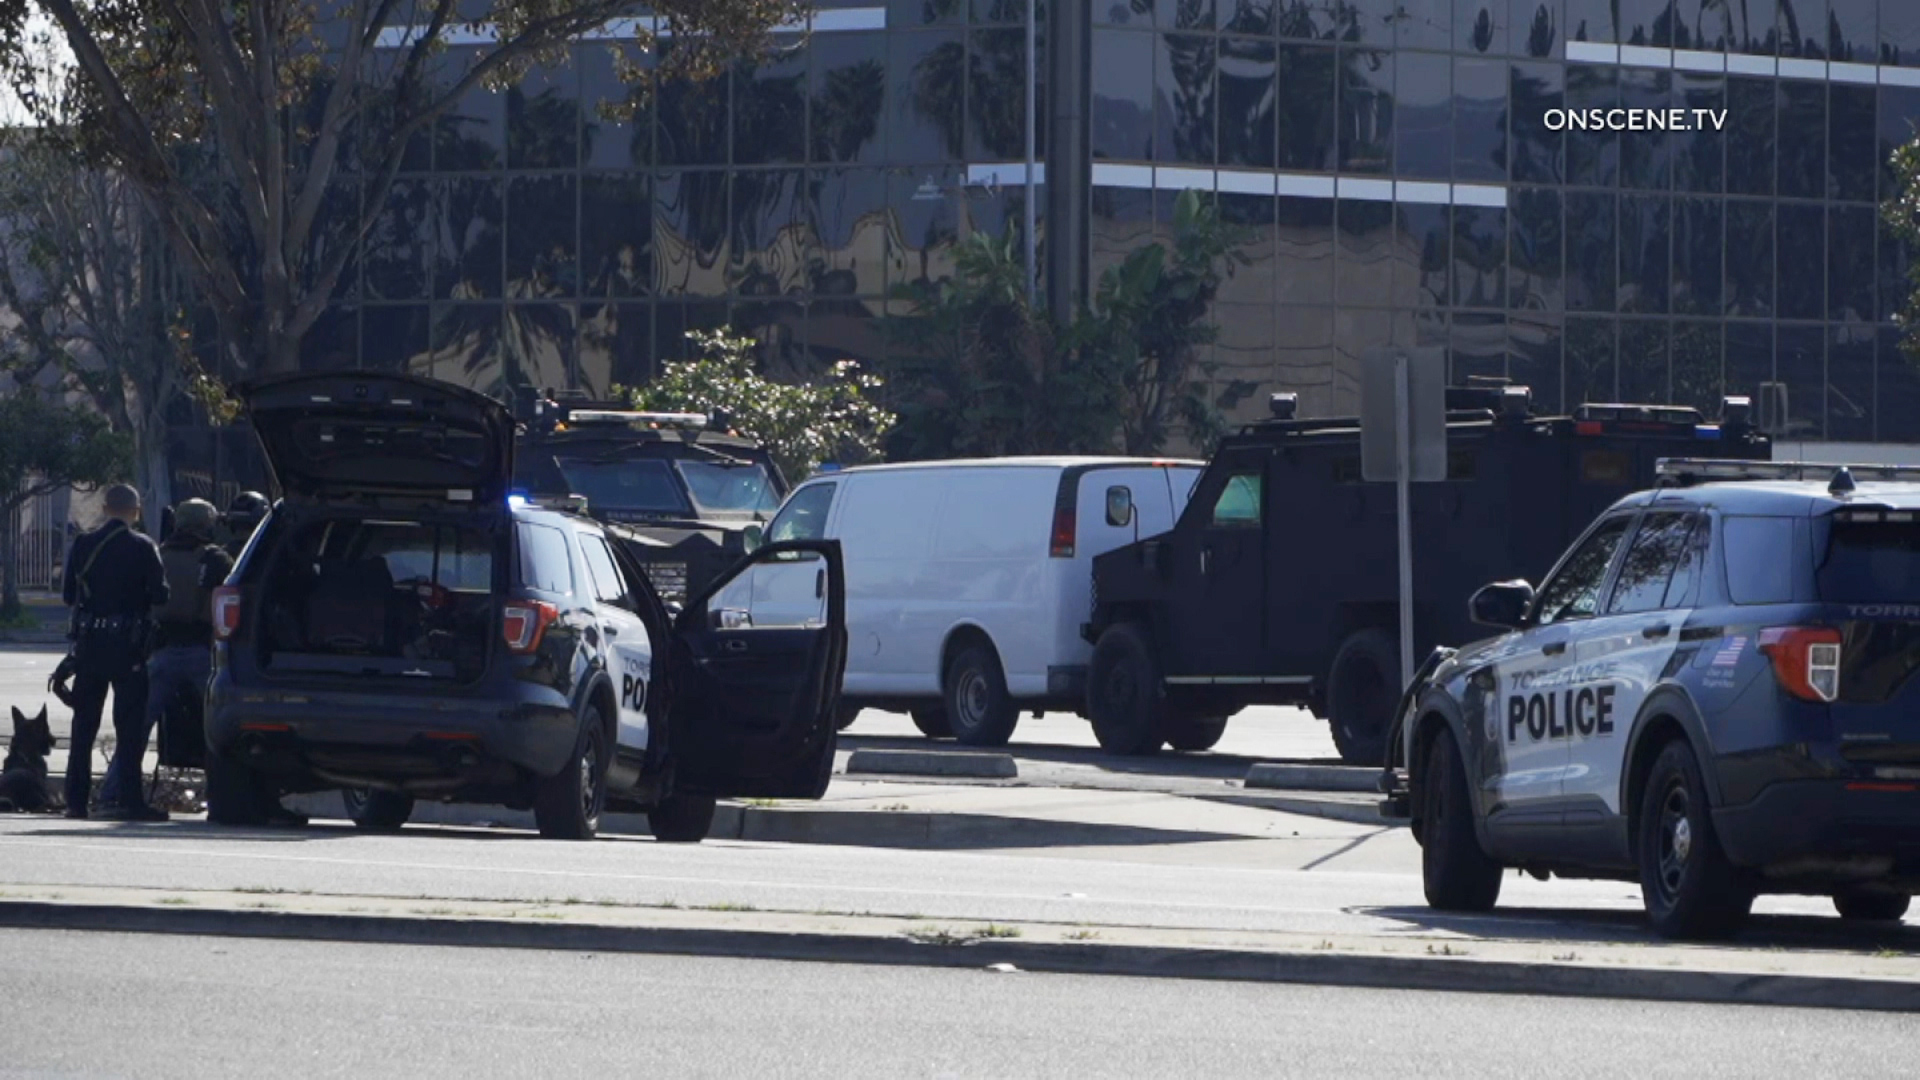
Police vehicles surround a white van during a standoff in Torrence, California, Sunday.
Police vehicles surround a white van during a standoff in Torrence, California, Sunday. (OnScene.TV)

There is an ongoing police standoff in Torrance, California, that is believed to be associated with the investigation into the Monterey Park shooting, a law enforcement source tells CNN.

Torrance is a city in Los Angeles County's South Bay region, located about 30 miles southwest of Monterey Park.

An employee at a store across the street from the standoff told CNN they were told to lockdown.

The employee said they have been on lockdown since around 11:45 a.m. local time, when a police officer came in and told them to remain inside. The employee said the entire shopping complex, which includes a PetSmart, Walmart and Hobby Lobby — in addition to other smaller stores — is locked down.

Customers and employees are currently hunkered down inside the store until they receive an all clear.

https://edition.cnn.com/us/live-news/los-angeles-mass-shooting-01-22-2023/h_6f8f83a90845c44eff70fbb22cf67df7

'Historically Slow' Growth Rate in U.S. Drug Spending Over Next 5 Years, Predicts IQVIA Report

 Spending using net prices (prices after discounts and rebates are factored in) will grow between -1% and 2% between 2023 through 2027, say IQVIA analysts in the company's Global Use of Medicines report. Patent expiration and competition from generics and biosimilars and the healthcare-related provisions of the Inflation Reduction Act will push down spending, predict IQ.

Spending on drugs in the U.S. on a net-price basis will grow at a “historically slow” rate over the next five years because of Inflation Reduction Act and competition from generics and biologics according to the IQVIA’s Global Use of Medicines report.

The report, published today, projects that compound annual growth rate (CAGR) of spending at the net level (invoiced prices less rebates and discounts) will be between -1% and 2% from 2023 through 2027, compared to 4% CAGR during the previous five-year period (2018 to 2022) and 5% CAGR during the five-year period before that (2013-2017).

The IQVIA report projects that U.S. spending on drug using invoiced prices will increase by $134 billion, or 21%, from $629 billion in 2022 to $763 billion in 2027. But according to IQVIA’s projections, once discounts and rebates are factored in, the growth will be only $18 billion, or 4%, $402 billion in 2022 to $420 billion in 2027.

By 2027, the report predicts, the total spending after discounts and rebates will be 45% lower than spending at invoiced amount ($420 billion vs. $763 billion).

The provisions of the Inflation Reduction Act that will affect spending on drugs include rebates if prices increase faster than the rate of inflation, the $2,000 cap on Part D out-of-pocket expenses and CMS negotiation of drug prices, starting with 10 drugs in 2026, the report says.

The IQVIA report estimates that “losses of exclusivity” will decrease spending by $141 billion over the next five years. The report says expiration of exclusivity (the end of patent protection) of small-molecule drugs will reduce spending on brand-name drugs by $98 billion and mentions Xarelto (rivaroxaban), a direct oral anticoagulants, in that context. Biologics losing exclusivity will reduced spending on brand-name drugs by $42 billion, the report says, citing Humira (adalimumab), which is expected to experience biosimilar competition this year, and Stelara (ustekinumab).

The 55-page report projects that global spending on drugs, before any discounts or rebates and excluding spending on COVID-19 vaccines and therapeutics, will grow 3% to 6% over the next five years, reaching $1.9 trillion in 2027.

Global spending on COVID-19 vaccines will reach $380 billion total for the seven years from 2020 to 2027. The IQVIA analysts say this is higher than previous IQVIA estimates, partly because the previous estimates assumed booster doses would be half of the regular doses.

https://www.managedhealthcareexecutive.com/view/-historically-slow-growth-rate-in-u-s-drug-spending-predicts-iqvia-report

Trump And Lawyers Hit With $938,000 Penalty For "Frivolous" Suit Against Clinton

 A federal judge has ordered Donald Trump and his lawyers to pay $938,000 in sanctions for having filed a "completely frivolous" lawsuit against Hillary Clinton and others, claiming they attempted to rig the 2016 election by smearing Trump with allegations that he was colluding with Russia.   

“We are confronted with a lawsuit that should never have been filed, which was completely frivolous, both factually and legally, and which was brought in bad faith for an improper purpose,” wrote Judge Donald Middlebrooks in a 46-page order issued in U.S. District Court for the Southern District of Florida.

Gee, it's a small world -- Middlebrooks was nominated by Bill Clinton in 1997.

U.S. District Judge Donald Middlebrooks (J. Albert Diaz via Law.com

In April, Trump's lawyers filed a motion asking the judge to recuse himself from the case, arguing that "because her husband nominated Judge Middlebrooks to the Federal Bench, there exists a reasonable basis that Judge Middlebrooks’ impartiality will be questioned.” He denied the motion, citing precedents. 

Trump's lawsuit asked for $30 million in damages from Clinton and 30 other defendants, alleging racketeering, "a conspiracy to commit injurious falsehood" and other wrongdoing. When Middlebrooks threw the suit out in September, he said Trump "is seeking to flaunt a two-hundred-page political manifesto outlining his grievances against those that have opposed him."

Now Middleton has followed up by holding Trump, his lead attorney Alina Habba and Havva Madaio & Associates jointly and severally liable for $937,989.39That means the penalty, which covers the defendants' legal expenses, can be collected from any one or combination of the sanctioned trio.

Other defendants include the Democratic National Committee, its 2016 chair, Rep. Debbie Wasserman Schultz, Christopher Steele, and the FBI's James Comey, Andrew McCabe, Peter Strzok and Lisa Page. Middleton had previously ordered $50,000 in other sanctions in the case. 

"This case should never have been brought. Its inadequacy as a legal claim was evident from the start. No reasonable lawyer would have filed it. Intended for a political purpose, none of the counts of the amended complaint stated a cognizable legal claim," wrote Middlebrooks in his sanction order

Middleton repeatedly condemned Trump, also calling him "the mastermind of strategic abuse of the judicial process, [who] cannot be seen as a litigant blindly following the advice of a lawyer."

Middleton also criticized Habba for continuing to advance the central claims of the suit in media appearances, against the judge's order. He quoted her September interview with Sean Hannity, in which she said Hillary Clinton isn't being held accountable "because you have a Clinton judge...[who] basically ignored every factual basis which was backed up by indictments, by investigations, the Mueller report, et cetera..." 

"Thirty-one individuals and entities were needlessly harmed in order to dishonestly advance a political narrative," wrote Middleton, slamming Trump for "a continuing pattern of misuse of the courts." 

Meanwhile, there's been no accountability for Hillary and her allies having colluded with federal law enforcement officials to cultivate a patently false narrative that the Trump campaign colluded with the Russian government to steal the 2016 election. 

https://www.zerohedge.com/political/trump-and-lawyers-hit-938000-penalty-frivolous-suit-against-clinton

Elon Musk Reveals "Major Side Effects" After 2nd COVID Booster

 by Allen Zhong via The Epoch Times,

Elon Musk said he felt like he “was dying” after his second COVID-19 booster shot.

“I had major side effects from my second booster shot,” the new Twitter boss wrote in a social media post.

“Felt like I was dying for several days. Hopefully, no permanent damage, but I don’t know.”

Musk didn’t provide medical records to back his claim. Neither did he say which company’s COVID booster he took.

The Epoch Times can’t verify his claim independently.

Moderna and Pfizer didn’t respond to requests for comments at the time when the article was published.

He took Johnson & Johnson’s COVID-19 vaccine and the first mRNA booster without side effects, Musk said.

Musk posted a string of Twitter posts in response to a post by Rasmussen Reports which is criticizing the Centers for Disease Control and Prevention (CDC)’s narrative that major side effects after COVID vaccination are “rare.”

Americans Link COVID Vaccines to Mysterious Deaths

A new Rasmussen Reports poll, released on Jan. 2 and based on a representative sample of 1,000 American adults, shows that nearly half of Americans believe that the COVID-19 vaccines probably caused a “significant number of unexplained deaths,” while over a quarter said they personally know someone whose death may have been caused by vaccination side effects.

Pollsters asked people a series of questions, including whether they got the COVID-19 shot and how likely is it that the jab’s side effects “have caused a significant number of unexplained deaths.”

Forty-nine percent of the respondents said they think it’s “likely” that the COVID-19 vaccine’s side effects are responsible for a significant number of deaths that remain unexplained.

A large majority (71 percent) said they themselves have been vaccinated against COVID-19, with 38 percent of those believing that the vaccine side effects are at least somewhat likely responsible for unexplained deaths.

Among the 26 percent who said they haven’t been jabbed, 77 percent said it’s at least somewhat likely that the vaccination’s side effects caused significant numbers of mysterious deaths, the survey found.

Another question was whether people think there are “legitimate reasons” to be worried about the safety of COVID-19 vaccines, or whether people who are concerned about vaccine safety “are spreading conspiracy theories.”

Forty-eight percent of respondents said they think there are legitimate reasons to be concerned about COVID-19 vaccine safety, 37 percent think people who are worried about this issue are pushing conspiracy theories, and 15 percent aren’t sure.

https://www.zerohedge.com/covid-19/elon-musk-reveals-major-side-effects-after-2nd-covid-booster

Where Did All The Workers Go?

 by Bret Swanson via The Brownstone Institute,

In a November 30, 2022, speech on “Inflation and the Labor Market,” Federal Reserve chairman Jerome Powell blamed most of the 3.5 million estimated shortfall in the US labor force on premature retirements.

He also blamed a large portion – between 280,000 and 680,000 – on “long Covid.”

In a footnote, however, Powell acknowledged a far more somber factor: an estimated 400,000 unexpected deaths among working age people. 

t’s easy to blame these deaths on Covid-19. The virus is of course one significant cause. But it’s not nearly the only cause, especially among young and middle-age workers.

We need better government data transparency to make a full assessment. Until then, we can proceed with others who track mortality for a living – life insurance companies. 

The Great Divide – 2020 vs. 2021

In 2020, Covid-19 took many lives, even among select groups of middle-age people, specifically those with comorbidities such as diabetes. In 2020, Covid did not take very many lives of healthy young and middle-age people – for example, the types of people who are employed at large and mid-size companies and who have group life insurance. As you can see in the chart below, group life insurance benefit payments in 2020 were barely higher than in 2018. 

In 2021, however, group life payments exploded by 20.7 percent over the five year average and by 15 percent over the acute pandemic year of 2020. Why would healthy young and middle-age people suddenly begin dying in large numbers in 2021 when they’d navigated 2020 with relative success?

Especially when we consider that in 2021, the US administered 520 million Covid-19 vaccine doses. Shouldn’t healthy people employed in good jobs with good benefits, now protected with vaccines, have fared better in 2021 than in 2020? Surely, overdoses and suicides have risen in recent years. But those causes of death are less prominent among the group life cohorts in general, and the latest data confirm these were not drivers of the group life surge. Curiously, two of the largest spikes in 2021 came from deadly automobile accidents and non-automobile accidents.

Millennial Mortality

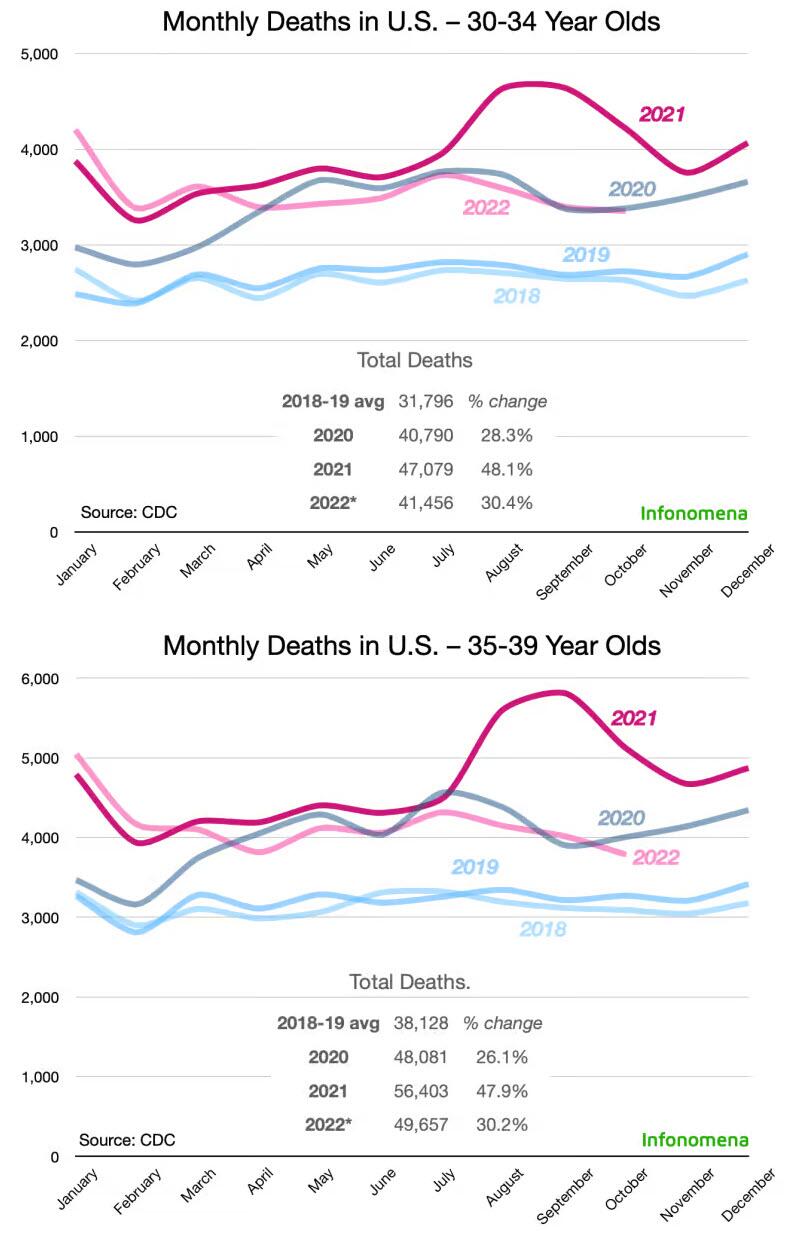
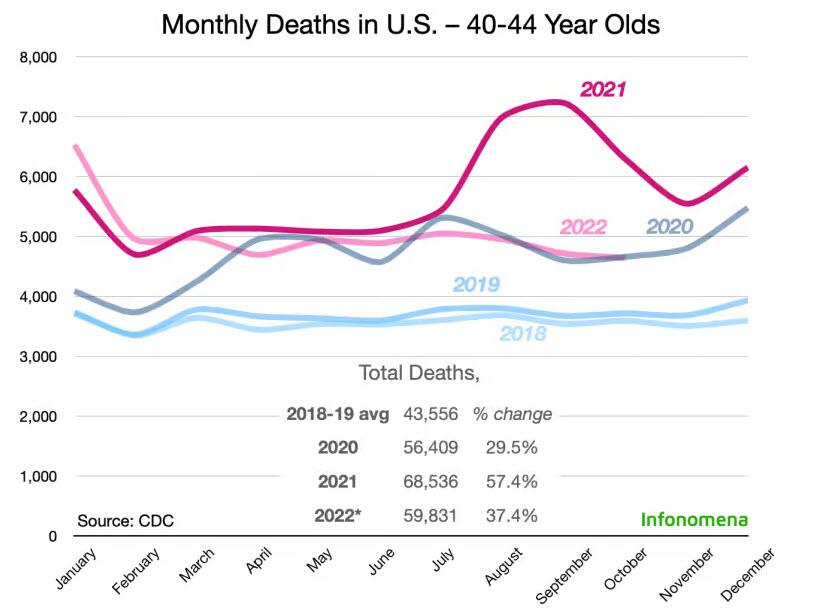
Let’s look at a few of these young adult age groups in more detail. In the charts below, we’ve broken out total all-cause deaths into three groups – 30-34, 35-39, and 40-44. Eyeballing the age group charts alone shows that factors other than Covid-19 itself must have driven large portions of the mortality spike in young and middle-age workers. (We are using official statistics, which likely overstate Covid mortality and understate non-Covid mortality. It’s the best we’ve got for now.)

  • The most important overall point is that 2021 was far worse for young and middle-age people than 2020. 

  • Another key point is that 2022 was also worse than 2020, though not as bad as 2021. 

  • Mortality rates in 2022 were still dramatically higher than the pre-pandemic baseline.

In the three charts above, we estimate 2022* total deaths because November and December are still provisional and subject to upward revisions. We’ve made what we believe are reasonable projections. The % change figures are relative to the 2018-19 average. These are absolute numbers not adjusted for population growth or cohort size.

Covid-19 hit hard in 2020, especially for the old, vulnerable, and comorbid. In other words, Covid-19 took many of the most unhealthy from us in 2020. In principle, therefore, a smaller number unhealthy people might have been susceptible to Covid-19 in 2021 and 2022. High mortality years are often followed by low mortality years. After two successive high mortality years, the third year is even more likely to be low-mortality. For 2022 to be as bad, or somewhat worse, than 2020, is thus a big surprise. Last year’s milder Omicron variants make 2022’s stubbornly high mortality rate even more baffling. 

All-cause mortality is crucial to understand whether public health policies are working. All-cause numbers can also help expose faulty reasoning when overly narrow, overly complicated, or overly clever analyses miss or hide important signals. For example, an analysis which purported to show lockdowns reduced Covid deaths but which neglected to show other deaths rose even more, would not reflect the totality of the policy’s effects. Likewise, a chemotherapy which shrinks tumors but kills patients may be successful in its narrow task yet fail the larger mission. Most analysts and health authorities studiously ignored all-cause over the last three years. The all-cause figures above show our Covid policies were far from successful.

For other purposes, however, it’s helpful and even necessary to drill down on specific causes. Important signals can also be lost in large groupings – Simpson’s paradox, for example, is a common statistical illusion. (Few have dug deeper, with as much specificity, as John Beaudoin, an engineer from Massachusetts who gained access to his state’s digital death records for the last eight years. He shows that specific causes of death spike and fall at important moments and periods. CDC data is not organized with such granularity. More on Beaudoin’s analysis in coming weeks…)

We know that recent years saw an upswing in drug overdoses and suicides, which accelerated with the pandemic lockdowns. Although these troubling trends cannot explain the enormous and unprecedented all-cause mortality seen above, we should attempt to account for them. Likewise, although Covid-19 did not cause all these record deaths, it was a significant factor. 

Employment Aberration

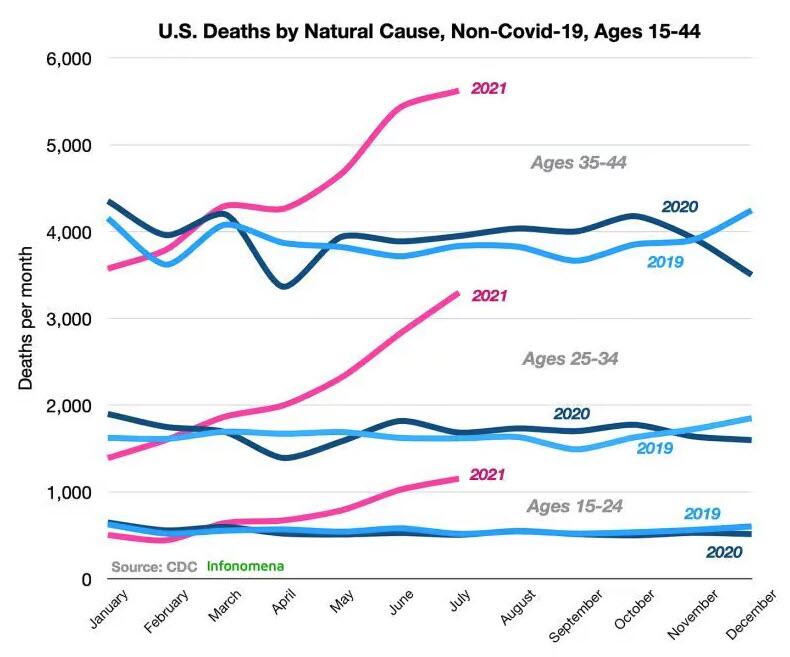
So we dig deeper. If we remove both Covid-19 and unnatural deaths (homicide, suicide, overdose, etc.), we see a dramatic spike of natural, non-Covid-19 deaths among working age people beginning in the spring and summer of 2021. The CDC then stopped publishing the detailed data breaking out these particular categories. 

But we know this trend continued. In fact, it got much worse. The life insurance companies told us so. On a December 30, 2021, videoconference with the Indiana Chamber of Commerce, OneAmerica CEO Scott Davison reported with shock:

“And what we saw just in third quarter, we’re seeing it continue into fourth quarter, is that death rates are up 40% over what they were pre-pandemic.”

“40% is just unheard of.”

“It may not all be COVID on their death certificate, but deaths are up just huge, huge numbers.”

Several months later, Lincoln National reported its 2021 payouts were $1.4 billion, versus $548 million in 2020, a 164 percent rise.

As you will remember seeing in our three all-cause charts, August, September, and October of 2021 showed a gigantic upward bubble – the worst ever period of concentrated young and middle-age deaths, at least in modern times. 

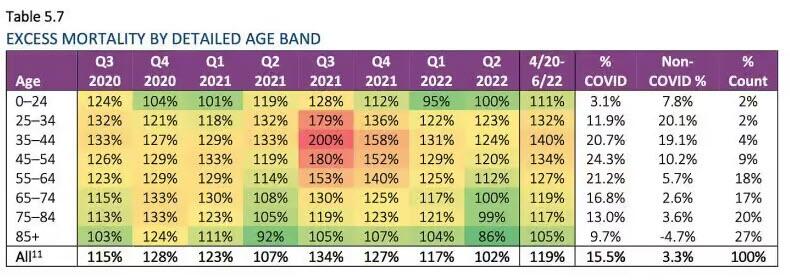
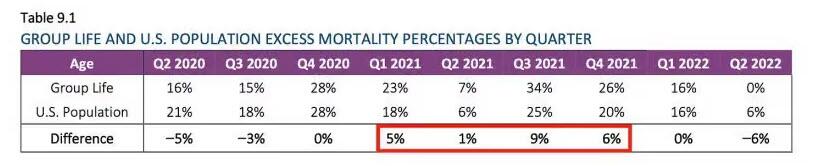
Heart attacks, strokes, pulmonary embolisms, accidents, and many seemingly-inexplicable sudden deaths, which continued into 2022, and now in 2023. Here is the Society of Actuaries November 2022 update, which goes through June 2022. 

Source: Society of Actuaries, Group Life Covid-19 Mortality Survey Report, November 2022.

It’s true that the late summer and fall period of 2021 coincided with the Delta wave in the US, which was more infectious and appeared to be more pathogenic than previous variants. (We’ve suggested the mass vaccination programs may have, by exerting extreme evolutionary pressure, driven convergence onto more infectious, vaccine-evading variants. Brand new research just published in the New England Journal of Medicine continues to bolster our escape variant thesis: Substantial Neutralization Escape by SARS-CoV-2 Omicron Variants BQ.1.1 and XBB.1.)

Federal officials and the medical establishment, you will recall, argued in 2021 that it was a “pandemic of the unvaccinated.” Even the Society of Actuaries attempts to explain away its alarming findings by implying the deaths are due to lack of vaccination. It does so with crude regressions of excess mortality and bulk statewide vaccination totals as of June 30, 2021. 

But remember those 520 million vaccine doses. How can you generate far more deaths in 2021 – ascribing them to unvaccination – with a dramatically smaller number of unvaccinated people? In 2021, perhaps 20-40 percent of these group life insureds were unvaccinated. In 2020, 100 percent of them were unvaccinated, yet mortality barely rose. The math doesn’t come close to working. 

The 40-44 age group, for example, suffered 21.5 percent more total deaths in 2021 than 2020. This terrible outcome occurred with less than half the so-called susceptible population due to their unvaccinated status. It’s difficult to assert robust vaccine effectiveness when both doses-delivered and deaths are skyrocketing.

On the other hand, the group life insurance data show vaccinated groups may have suffered the worse outcomes. By August, most large and mid-size companies and organizations across the country had vaccine mandates, and most employees complied. Yet these workers suffered extraordinary – indeed, totally unprecedented death rates – in 2021, especially the second half of 2021.

Source: Society of Actuaries, Group Life Covid-19 Mortality Survey Report, November 2022.

Ed Dowd, a former BlackRock portfolio manager, points to a crucial peculiarity in his book Cause Unknown. Employed people with group life insurance policies are far healthier than their overall population cohort. They typically die at a significantly lower rate, just 30-40 percent of the overall population. This is an iron actuarial law. In 2021, however, as you can see in the chart directly above, these employed Americans died at excess rates far higher than their larger pool of less healthy peers.

We could also point to fast-rising disability as a key factor in the worker shortage. Fed chair Powell blames it on long Covid. Once again, however, the timing doesn’t fit that story very well. 

To overgeneralize: 

In 2020, the vulnerable died of Covid at unusually high rates. In 2021 and 2022, Covid continued its assault, but the young, middle-aged, and healthy also died in aberrantly high numbers of something else.

These patterns are repeating across the high-income developed world – Germany, the UK, Japan, South Korea, Australia. 

https://www.zerohedge.com/markets/where-did-all-workers-go

Unions Faltering: Nationwide Membership Rate Hits Record Low

 The proportion of wage and salary workers who are members of unions has dropped to a record low, according to a Thursday data release from the U.S. Bureau of Labor Statistics. 

The union membership rate dropped from 10.3% in 2021 to 10.1% in 2022, the lowest mark in a data series that goes back to 1983. Of course, you'd have to go back much farther than 40 years to find a lower rate: University research puts membership in 1964 near 30%.  

The new low comes despite a major surge in union-organizing efforts that started during the Covid-19 pandemic. As we reported in July, the number of workplaces filing union petitions hit a six-year high over the first six-months of the year. 

Those organizing efforts have included headline-making campaigns to organize Starbucks outlets, Amazon warehouses and Home Depot stores. Those efforts have been hit-and-miss, with successful efforts commanding far more media attention than the failures. In November, employees of a Philadelphia Home Depot overwhelmingly shot down a union proposal by a 165-to-51 vote. 

“The BLS numbers are another reminder that headlines from cheerleading reporters and influence in the halls of power in DC are no substitute for actual support among hardworking rank-and-file American workers,” said National Right to Work Foundation Vice President Patrick Semmens.  

The lackluster unionization rate also came at a time when Democrats controlled the White House and Congress. It's not for lack of trying: Most recently, the National Labor Relations Board changed rules to allow smaller groups of employees to form "micro-unions" within a given employer. Imagine the pay, work-rule and benefit complications an employer would face if the mailroom has a union and the rest of the company doesn't. 

AFL-CIO President Liz Shuler blamed the poor 2022 showing on "illegal opposition" from employers. "The wave of organizing will continue to gather steam in 2023 and beyond despite broken labor laws that rig the system against workers,” she said

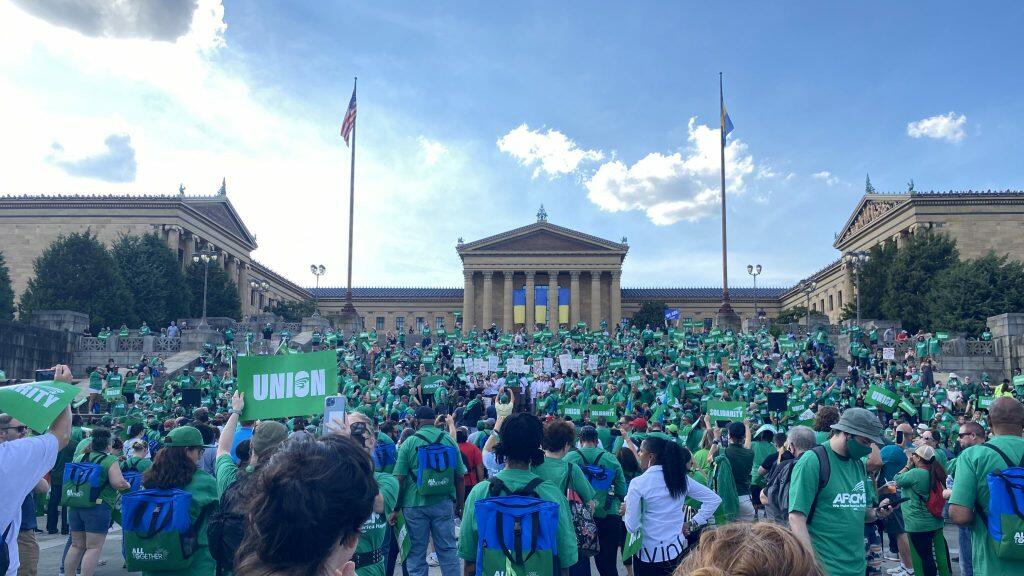
In July, AFSCME union members rallied to support the union of workers at the city-owned Philadelphia Museum of Art (photo: artnet)

The membership rate among government employees more than quintuples that of private sector workers -- 33.1% for so-called "public servants" compared to just 6.0% for those who pay the the public employees' salaries. Just for starters, the National Education Association (NEA) public teacher union has 3 million members and the American Federation of State, County and Municipal Employees (AFSCME) has 1.4 million

Some other interesting data points from the release

  • Blacks employees (11.6%) are more likely to be be union members than whites (10.0%), Hispanics (8.8%) or Asians (8.3%).
  • The two states with the highest union rate are Hawaii (21.9%) and New York (20.7%). The lowest are South Carolina (1.7%) and North Carolina (2.8%)
  • The most unionized occupations are public safety (34.6%) and education (33.7%). The lowest are sales (3.0%) and computer and math jobs (3.3%).  

Fed's $8 Trillion Hoard Of Financial Assets

 by Ryan McMaken via The Mises Institute,

It’s a sure bet that as the economy worsens, unemployment surges, foreclosures rise, defaults climb, and economic misery ensues, we’ll be told it’s all capitalism’s fault. The question one must ask, however, is, “What capitalism?”

The claim that “too much” capitalism drives every economic calamity is standard among anti-capitalists on both the left and the right. They have many bullet points claiming government programs and government spending are everywhere retreating while free-market capitalism is experiencing a resurgence. This can be easily shown to be empirically false. Evidence can be found in everything from the continual flood of government regulations to rising per capita taxation and spending to the growing army of government employees. That’s all in the United States, mind you, the supposed headquarters of “free-market capitalism.” We might also point to how the US welfare state, including the immense amounts of government spending on healthcare and pensions, is on a par with European welfare states in terms of size. The supposed lack of social benefits programs in the US has long been a myth. The trend in spending, taxation, and regulation is unambiguously upward.

In recent years, though, one additional indicator of just how little capitalism is actually going on has surfaced: central banks around the world are buying up huge amounts of financial assets in order to subsidize certain industries, inflate prices, and generally manipulate the economy.

This is certainly true of the American central bank, the Federal Reserve.

How the Federal Reserve Came to Dominate Financial Asset Markets

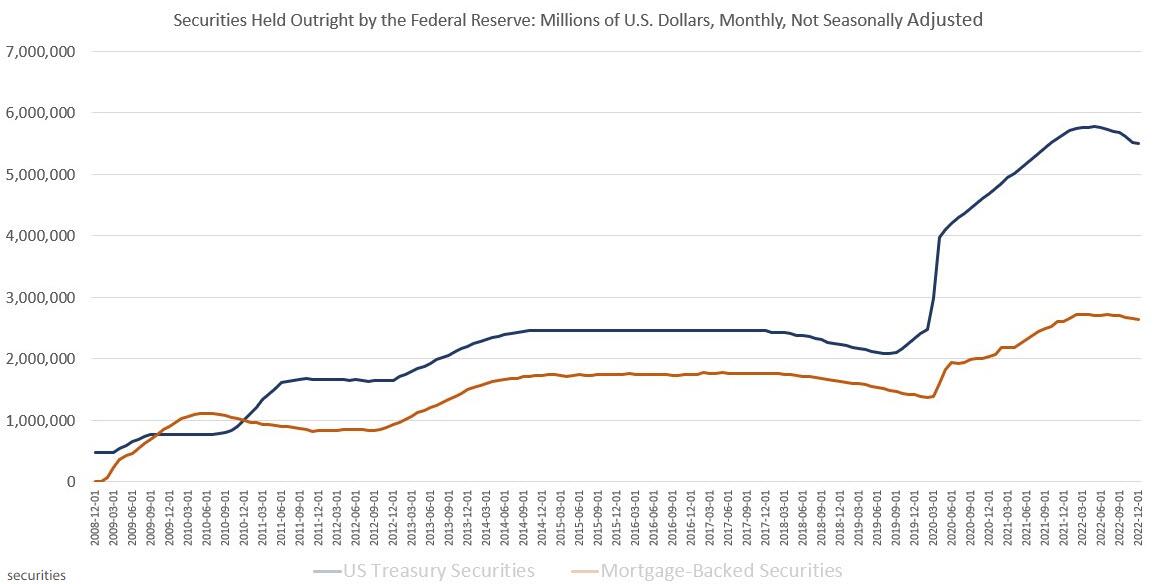
While the Fed has long bought government debt in its so-called open-market operations to manipulate the interest rate, wholesale buying of financial assets began in 2008. This included both US government Treasurys and—in a new development—private-sector mortgage-backed securities (MBSs). This was done to prop up banks and other firms that had bet on the lie that “home prices always go up.” The value of mortgage-backed securities was falling fast, so beginning in 2008, the Fed bought up MBSs to the tune of $1.7 trillion. That was all before covid.

Source: Federal Reserve Economic Data (FRED) (“Balance Sheet: Total Assets: Securities: U.S. Treasury Securities” [QBPBSTASSCUSTRSC], Federal Deposit Insurance Commission [FDIC], last modified December 2, 2022; and “Assets: Securities Held Outright: Mortgage-Backed Securities: Wednesday Level” [WSHOMCB], Board of Governors of the Federal Reserve, last modified January 12, 2023).

The Fed attempted to begin selling off its portfolio in 2019, but by then the market was already so addicted to Fed money that the economy began to slow and a liquidity crisis in repos ensued. The covid panic was what prevented a full-blown recession in 2020: the federal government began a spree of deficit spending, and the Federal Reserve hoarded even larger amounts of assets, bringing totals to new record-breaking highs.

The MBS portfolio climbed to $2.7 trillion.

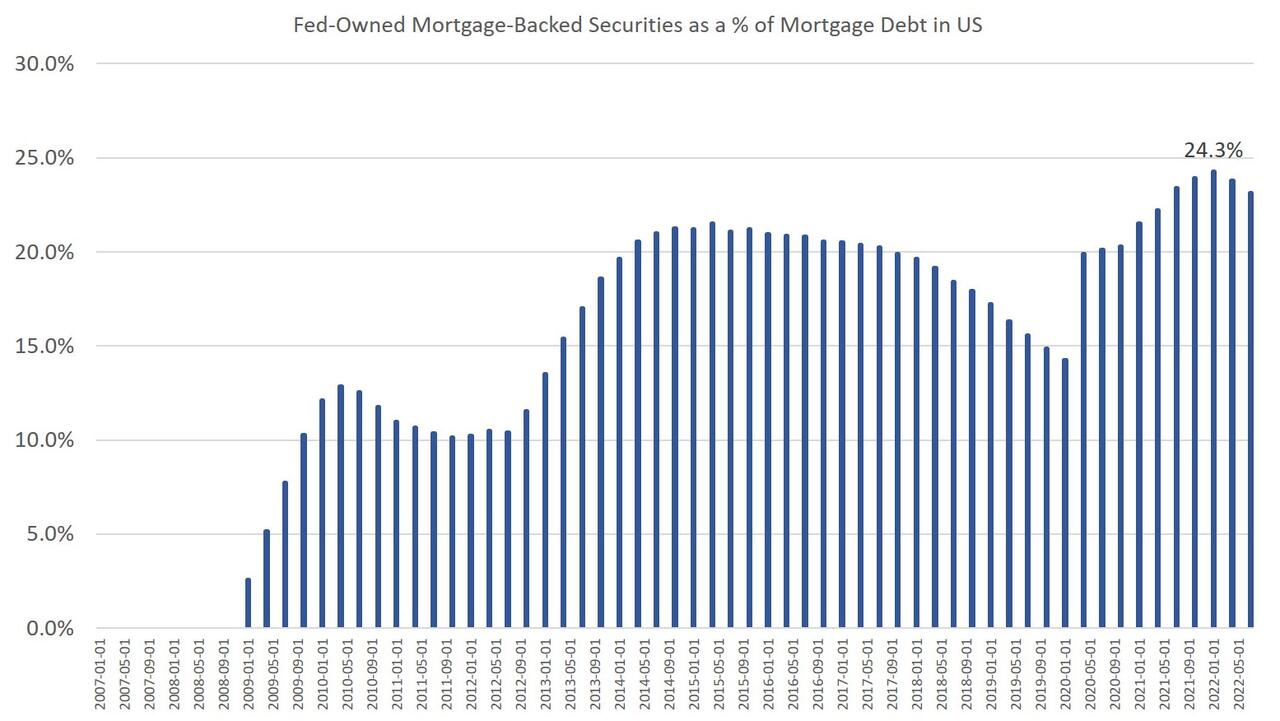
These sorts of volumes of assets are not an insignificant part of the overall market, either. Since 2020, the Fed’s MBS stockpile has equaled at least 20 percent of all the household mortgage debt in the United States. In early 2022, Fed-held MBS assets peaked at 24 percent of all US mortgage debt, but they still made up over 20 percent of the market as of late 2022.

Source: Federal Reserve Bank of New York Research and Statistics Group, Quarterly Report on Household Debt and Credit, 2022:Q3 (Center for Microeconomic Data, November 2022); and FRED (“Assets: Securities Held Outright: Mortgage-Backed Securities: Wednesday Level” [WSHOMCB], Board of Governors of the Federal Reserve, last modified January 12, 2023).

One can only speculate as to the full extent to which markets are distorted by the central bank holding one-fifth of mortgage debt, but one thing is for sure: one cannot say that this is any sort of “capitalism” at work.

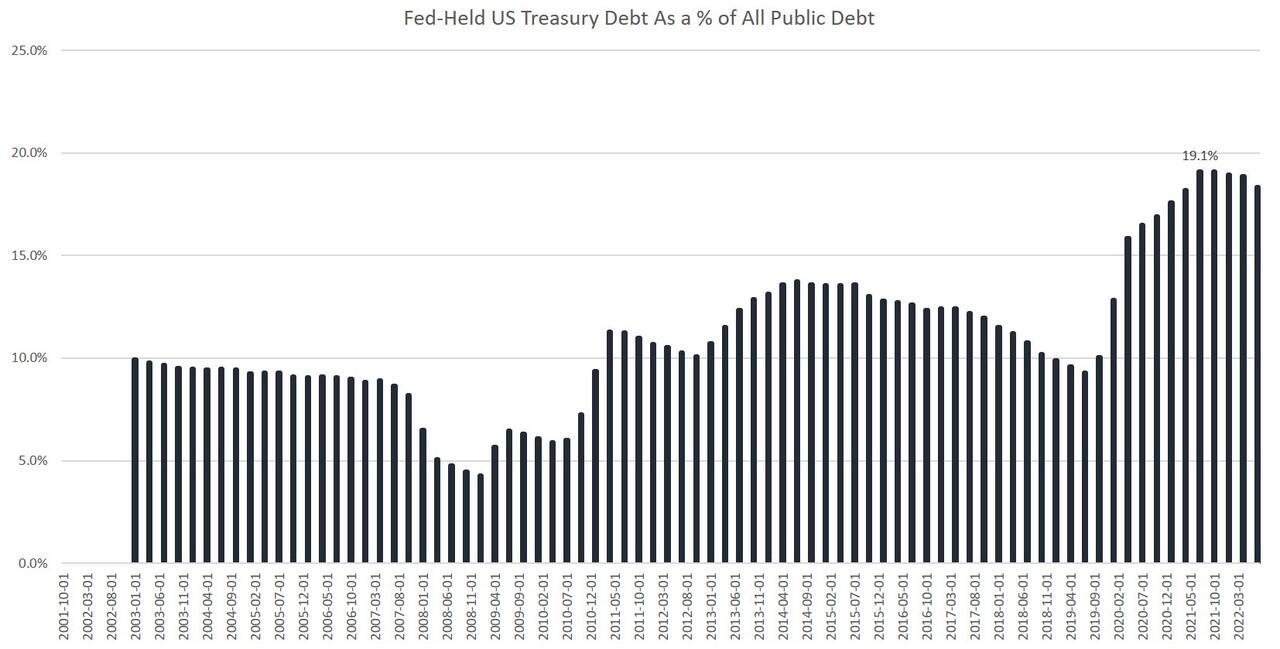
The story is similar with Treasury debt, and the timeline is largely the same as with the MBS assets. The Fed bought up about $2.5 trillion in US government bonds from 2008 to 2015. An attempt at scaling this back was aborted when the economy proved to be too fragile in late 2019. Then, the Fed gorged on Treasury debt in 2020 and 2021, bringing its government bonds total to nearly $6 trillion.

As a percentage, the Fed’s share of all Treasury debt has totaled more than 15 percent since 2020. It peaked at 19 percent in 2021. All foreign holders combined hold 33 percent of Treasury debt. This makes the Fed, by far, the largest domestic holder of US government debt: the Fed holds nearly 40 percent of all domestically held Treasury debt, putting it far ahead of entire sectors, such as mutual funds, which hold “only” around 22 percent of this debt.

Source: FRED (“Balance Sheet: Total Assets: Securities: U.S. Treasury Securities” [QBPBSTASSCUSTRSC], Federal Deposit Insurance Commission [FDIC], last modified December 2, 2022).

It’s also helpful to keep in mind that US Treasurys are a huge portion of the debt markets overall. For example, corporate debt in the US totals around $11 trillion. Even if we add this to the US Treasury debt, we still find that the Fed holds more than 10 percent of debt assets.

Of course, it would be absurd to call this situation anything resembling even “mostly” laissez-faire, let alone a free market. Imagine if a federal government agency—which is all the Fed is—owned 10 percent of all supermarkets or 10 percent of all Wal-Marts or 10 percent of all stocks. We would say that the agency in question possessed an enormous amount of power to move and manipulate markets as it willed.

That is where we are with these debt markets, and it’s become increasingly so since 2008.

Fannie and Freddie Do It Too

Nor is the Fed the only federal agency involved. We might also point to how the government-sponsored enterprises (GSEs) have come to dominate the secondary markets in mortgages. For example, Fannie Mae, Freddie Mac, and Ginnie Mae have been going on annual mortgage debt shopping sprees:

From 2009 to 2020, Fannie and Freddie’s annual share of the total MBS market averaged 70 percent. If we include Ginnie Mae securities, those that are backed by FHA [Federal Housing Administration] mortgages, the federal share of the MBS market averaged 92 percent per year.

Much of these MBSs, naturally, have ended up in the hands of the Fed.

So, now would be a great time to stop pretending that the financial sectors are “free market” or that price inflation and cost-of-living surges are somehow all the fault of “capitalism.” Federal agencies are the biggest players here, and their role is to manipulate markets to achieve centrally planned government goals. Private markets are growing more irrelevant every day.

https://www.zerohedge.com/markets/dont-call-it-capitalism-feds-8-trillion-hoard-financial-assets