As U.S. healthcare slides toward collapse, Americans are looking in the wrong direction for a cure. They are trying to cut costs and save money in order to make healthcare affordable. No one is focusing what really matters: dollar efficiency.
To avoid miscommunication, terms should be clearly defined. Healthcare, one word, refers to a complex system that cost Americans $3.65 trillion in 2018 (19.4 percent of U.S. GDP). That amount is 130 percent of Great Britain’s GDP.
Health care as two words includes the services or work product of health professionals as well as the goods and devices involved in diagnosis and treatment. Health care is a legally protected fiduciary relationship between a patient and a care provider.
Cost in healthcare is often expressed in confusing, incomplete, and inaccurate ways. When I asked a hospital CFO how much it cost to do a cardiac catherization, he accessed his computer and told me a number in thousands of dollars. When I asked how he knew this, he answered, “Simple. We divided the number of catheterizations you did by the budget allocation for the catherization lab.” There was no aggregation of costs such as labor hours, disposables, durable goods and devices, amortization schedules, and overhead.
True or accounting cost is the sum of all sellers’ expenditures necessary to bring products or services to market. Costs in healthcare are not accounted that way. They are allocated or calculated. Out-of-pocket cost is the consumer’s personal expenditure.
Dollar efficiency refers to the percentage of dollars that go into a system or organization that contributes to desired outputs or outcomes. In healthcare, efficiently spent dollars are those that produce what patients (consumers) need: care. Having insurance might be a necessary process step, but only if it leads to the desired outcome: care. Similarly, saving money is a desirable phase of the process but not an outcome. No one wants to save money if such saving leads to unfavorable medical outcomes, such as the death-by-queueing experienced by those with government-supplied Medicaid and TriCare insurance.
Financial Data
Some financial facts are widely accepted. In 2018, the average American family of four spent $28,166 on healthcare costs, the majority on insurance premiums and the remainder on deductibles and co-pays. Fifty-six percent of the total was paid by employers. The 44 percent expended on healthcare by employees ($12,378), by the employee represented 20 percent of gross (pre-tax) median household income. That amount is $18 more than the median 2018 annual mortgage payment of $12,360 per year, making healthcare the most expensive item in a family budget.
As a nation, the U.S. expended $3.6 trillion in 2018 on healthcare. Using latest available data, Table 1 compares U.S. spending on healthcare to other nations.
| Table 1: National Spending on Healthcare (2017) | |
| Nation | Per capita spending |
| Great Britain | $4,246 |
| Australia | $4,543 |
| Japan | $4,717 |
| Canada | $4,826 |
| Sweden | $5,511 |
| Germany | $5,728 |
| Switzerland | $8,009 |
| United States | $10,224 |
| Source: Sawyer B, Cox, C. How does health spending in the U.S. compare to other countries? Peterson-KFF Health System Tracker. 2018. | |
Accurate, reliable data on dollar efficiency in healthcare is limited. Twenty years ago (1999), Woolhandler and colleagues reported a comparative analysis of healthcare administrative (non-care) spending in Canada and the U.S. While one can question some of the costs they excluded from consideration, nonetheless, their conclusion provides a minimum estimate. Canada expended 16.7 percent of their healthcare dollars on non-care activities, and the U.S. spent nearly double, 31 percent.
It is worth noting that 1999 was more than a decade before the expansion of healthcare bureaucracy associated with the Affordable Care Act. When U.S. dollar efficiency was estimated in 2013, between passage of the ACA (2010) and its implementation in 2014, the conclusion was 40 percent dollar inefficiency where the 1999 estimate was 31 percent.
There is a surprisingly simple explanation for why the U.S. is spending so much more on healthcare than other nations and why the cost of health insurance, unaffordable before Obamacare, has “increased substantially” — doubled, in fact, according to Health and Human Services. The primary reason is growth of the federal healthcare bureaucracy with its attendant costs.
From 1970 to 2010, the U.S. supply of physicians increased 150 percent. During the same time period, the supply of healthcare administrators grew more than 3000 percent. The solid line in Figure 1 shows that U.S. spending increased nearly 2500 percent. This line’s shape and slope closely reflect the growth in the supply of bureaucrats.
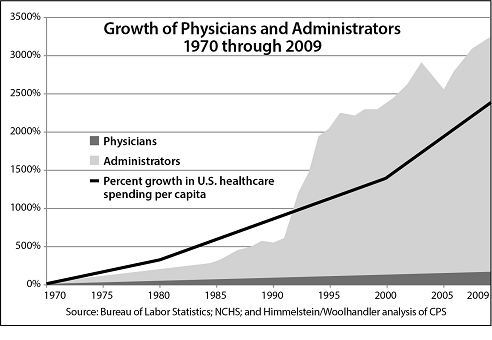
Growth in Supply of Healthcare Providers and Administrators, 1970 to 2010
Just like the Woolhandler 1999 data, Figure 1 does not include the effect of bureaucratic expansion directly related to implementation of Obamacare in 2014. It is very unlikely that the number of physicians increased, but the supply of bureaucrats most definitely did, along with the costs. Examples of new bureaucratic spending include expansion of Medicaid; a website, that cost $2 billion; standing up the Health Insurance Exchanges; and thousands of new bureaucrats. ACA was so complex and confusing it had to create a whole new category of bureaucrats called navigators, to “navigate” Americans through the maze of new, often contradictory regulations. The total cost of the ACA was estimated to be $1.76 trillion, mostly expended on administration, bureaucracy, rules, regulations, and compliance. This is healthcare spending that cannot be used for care.
A jobs report released in December 2019 indicated the healthcare sector added 414,000 new jobs in the past twelve months. If these new jobs follow the same pattern as healthcare job growth in the past, more than 90 percent will be non-value-adding jobs, meaning Americans pay salaries for people who don’t provide patient care.
Measuring Dollar Efficiency
Management experts know you get what you measure and reward. Since Americans are not getting what they want — affordable, available care — they need to measure and reward something other the number of insured individuals as we do now, something like dollar efficiency.
Texas has the highest uninsured rate in the U.S., 17.1 percent, and New York has the lowest at 5.4 percent. Considering insurance coverage, New Yorkers are doing well and Texans are not. Yet, access to care tells a different tale. In New York, the primary care needs of patients were satisfied 45 percent of the time; and in Texas, they were satisfied 71 percent. Money expended to provide no charge Medicaid coverage is clearly dollar inefficient. It rewards the outcome patients don’t want.
Healthcare spending can become dollar efficient if the consumer/patient is reconnected with the seller/provider directly. This means the patient, not a third party, is the payer. Providers will compete for patients’ dollars, not for insurance money. In such a market-based system, expenditures will be connected to consumers’ desired outcomes. When the payer is a third party such as an insurance company or government, rather than the consumer, money will be expended on what the third-party desires, not what patients want. Direct connection of patient with provider aligns spending incentives with care.
The federal bureaucracy, the largest consumer of healthcare dollars, does not provide patient care. Thus, it is the primary driver of dollar inefficiency. If the Washington no longer dominated healthcare and Americans were free to decide their own healthcare, an approach called StatesCare, more than a trillion “healthcare” dollars would no longer be spent inefficiently and could be used for patient care. StatesCare combined with market-based medicine could dramatically improve healthcare dollar efficiency.
Deane Waldman, MD MBA is Professor Emeritus of Pediatrics, Pathology, and Decision Science, and author of Curing the Cancer in U.S. Healthcare: StatesCare and Market-Based Medicine.
No comments:
Post a Comment
Note: Only a member of this blog may post a comment.