by Law Ka-chung via The Epoch Times,
In 2024, presidential and congressional elections will take place in many countries.
There has been speculation for a long time that existing ruling regimes try their best to make the economy prosperous and market bullish in the run-up to an election. The underlying belief of this is that government policies, whether fiscal or monetary, are effective and efficient. The latter is crucial because this requires a policy launched in the election year to have an imminent impact on the economy or market.
If the pleasing actions by the existing ruling regime are more oral than practical, then soon after, people would find no improvements in the situation and see through such manipulation tricks.
Accordingly, whether actions are deeds more than words or words more than deeds does not really matter, because what matters is policies done previously if policies are to be effective.
What policies have been in place so far?
Clearly, there has been a series of monetary tightening over the past two years, which are supposed to generate the expected cooling impact in 2024.
Because of such a long lag in policy effects (if any), the election year might not exhibit prosperity as expected.
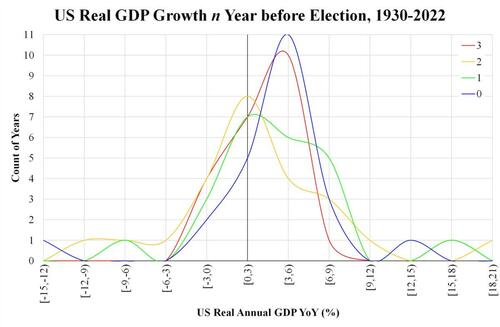
The accompanying chart counts the number of years having various real GDP (year-over-year) growth ranges by years (n) before an election. Here, n = 0 means election year, n = 1 means one year before election, and so on. The counts are presented as a histogram against real GDP growth. A distribution leaning towards the right means better real GDP growth. The data used are the official ones dated earliest from 1930, giving an almost a century’s record.
U.S. Real GDP Growth n Year Before Elections (1930–2022). (Courtesy of Law Ka-chung)
The chart shows the election year (blue line) having slightly better economic performance (leaning somewhat more to the right than other colors).
However, the central tendencies of these distributions might not differ statistically, although the dispersions might look a bit different.
Since there are only slightly more than twenty counts for each year, the small sample (< 30) properties do not allow too much statistical inference from these results.
What can be concluded is that the election year effect looks more like a slogan than anything statistical.
On a specific case level, there are many election years with bad economic performance, namely, 2020 with the COVID-19 lockdown, 2008 with a financial tsunami, and 2000 with the tech bubble burst.
As explained above, such belief relies deeply on the policy impact.
For 2024, the market expects the Federal Reserve to begin rate cuts as early as March.
Nevertheless, experience suggests monetary policy typically has a time lag of 1 to 2 years.
This means if the U.S. economy turns bad within this year, there is not enough time for any policy changes to put off the fire.
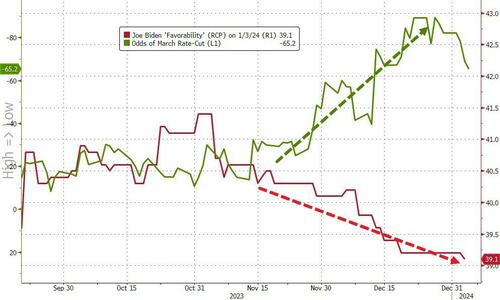
[ZH: The timing of Powell's sudden pivot - which sparked stocks to soar and soft-survey data to improve as rate-cut expectations spiked - happens to have coincided with the rapid decline in President Biden's approval rating...]
This might explain why n = 3 (red line) is also a good year because if a series of easings is made in an election year (n = 0), then the effect will be seen in the year (n = 3).
Will such history repeat this time? We must wait and see.
https://www.zerohedge.com/political/how-make-economy-better-election-year


No comments:
Post a Comment
Note: Only a member of this blog may post a comment.