Target to $301 from $277
Search This Blog
Thursday, January 4, 2024
The Times They Are A-Changin': How To Trade The Next Algo Shift
By Peter Tchir of Academy Securities
The Times They Are A-Changin’ – Impacting Market Signals & Correlations
We, the market, have collectively learned a few things in the past few years. Primarily lower yields = higher stocks. That was probably the single biggest lesson since COVID and ZIRP. Lower yields = higher stock prices.
We learned that stocks are “long duration” assets. We learned that tech stocks are even longer duration assets. The "everything" or "QE" trade became a dominant theme. It didn’t mean we didn’t experience “risk-off” days (bond yields lower, but stock prices lower), or “risk-on” days (bond yields higher, but stock prices higher), they just occurred with less frequency and they seemed to drive the market for shorter periods than in the past. The “traditional” risk-on or risk-off made a lot of sense. If the economy was doing well, bond yields should be higher, but stocks should be higher as well. And vice versa. Like, you know, bad news used to be bad, and good news used to be good.
The Role of Algos
I strongly believe that algo’s played a large role in enforcing this behavior of “lower yields = higher stock prices”. While AI needs to “learn” and be “taught”, I think many algo’s are much simpler. They are like sharks, almost mindlessly and mechanically, swimming through the water, looking for things to eat. This is neither an admonishment against algo’s nor praise for them, it is a simple fact about the market structure we live in.
The algo’s that identified “lower yields = higher prices” thrived. They likely bred other algos and certainly did well enough to be allocated more and more capital. As humans became committed to the concept of “lower yields = higher prices”, the algo’s still had first mover advantage, but that only helped solidify the relationship and possibly exaggerate it (make it larger than it should be). Throw in stop losses and even 0DTE options (zero day to expiration options) and we live in a world where moves can be fast and large, and often skewed to the “everything rally” trade.
Signals and Correlations Always Change and Are Moving Now
While the “everything rally” is far from dead, it seems very “last year.” I think sometimes when we go back and remember what the “tells” for the market were, we realize how varied they can be (anything from Chinese Treasury TIC data, to some survey of bank lending, etc) and how short-lived many are. Geopolitical may be short lived, but it is influencing markets right now.
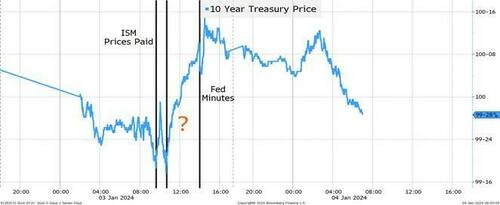
Let’s start with yesterday’s price action on the 10-year treasury. Treasuries tried to “bounce” in price terms right after the series of 10 am numbers. Prices paid on ISM were “better” than expected (a weird piece of data to glom on to, but it seems to excite the inflation is over camp (I used to be a card carrying member, so I can relate). JOLTS seemed to confirm last month’s “surprising” drop in jobs available and the QUIT rate was lower, while the HIRE rate was also lower – both bad for those looking for the bottom of the employment cycle). But that move was short lived.
Markets were “fixated” on the FOMC minutes due out at 2pm. Treasury prices initially declined (the minutes were not as dovish as the press conference, which is an important signal), and then resumed their march higher. Maybe that could all be explained from the reaction (and pre-positioning) of the FOMC minutes, but I believe something else was at work here.
Treasuries were marching higher from about 11am until 2pm. Was that all in anticipation of “dovish” minutes? (which we didn’t get) Or, was something else going on?
Like headline after headline about bombings in the Middle East. That was on top of previous headlines about warships and supply chains (see Academy’s Warship SITREP, and latest Around the World).
We’ve tightened up the chart to just yesterday’s trading.
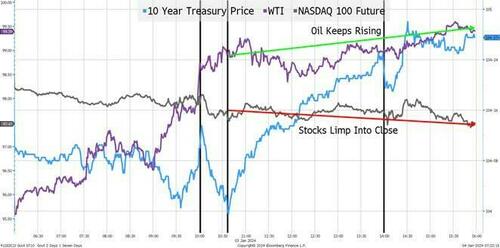
If this was an “everything” rally, stocks should have done much better than they did. They failed to pop on ISM/JOLTS (bad news is bad?), but more importantly (from a “changing” signal perspective) they faded as treasuries rallied all afternoon and stocks certainly didn’t behave as though the FOMC minutes were dovish (a correct interpretation).
Oil, popped earlier in the days (as soon as bombings hit the headline) and were well bid all day. Economic news was definitively NOT good for oil, yet oil was higher.
Signals and Correlations in Today’s World
Anyways, enough reminiscing about how things were, and let’s think about how to think about moves in today’s world. A world where geopolitical risk is high (markets don’t seem to care that according to reports, Xi says China firmly supports Iran in safeguarding security – which doesn’t seem good, especially given how much oil is allegedly finding its way from Iran to China).
I think we can start with the “safest” signal – oil.
Oil will rise and continue to rise as tensions intensify. The biggest risk, from my perspective is that the U.S. hits a point where it feels forced to curtail Iranian oil shipments. At some point, if this occurs, the Saudis may increase production, but that is unlikely to occur below $90 a barrel. I’m looking for oil prices to continue to move higher as this shifts from a traditional supply/demand story to a geopolitical interference risk story. I do like energy company stocks even better than oil, but both should work right now and are the major tell.
Stocks.
I like energy companies outright, so I’m almost getting the geopolitical risk for “free”.
I do not like the stock market here, as per previous T-Reports, and think higher energy prices, especially as a direct result of geopolitical tensions will weigh on stocks.
But what about bond yields, in their own right and how they will impact stocks?
Do NOT expect lower bond yields to be good for stocks. Bond yields are not going to be the main driver, certainly not every day, for stocks. Geopolitical risk is going to be a bigger factor and that will outweigh the impact bond yields have on stocks. If anything, we should see more “risk-on” and “risk-off” days, but look for some other signal to drive stocks as the bond/stock correlation isn’t the same as it was much of last year.
Finally, on the bond side of things, geopolitical tensions should help drive yields somewhat lower, at least initially. We could see the “classic” flight to safety trade in the early days, which seemed apparent yesterday.
My fear is that “flight to safety” doesn’t last.
- As oil prices go higher, will the Fed really shift to an easy money stance like they “normally” would in times of geopolitical stress/uncertainty? I do not think so, at least not initially.
- As tensions escalate, as munitions are used (and need to be replaced), as military activity across the globe increases, concerns about spending will rise.
- Now back to China TIC data. If China continues to deplete their inventory of bonds (largely through maturities rather than active selling), will that come back into focus?
The worst outcome, and one that I think is increasing in probability, is that we will see higher yields, higher oil prices and significantly lower stock prices.
If the algos that made all the $$$$$ by buying stocks whenever bond yields went lower start losing money, they will be shut down or constrained rapidly.
What happens when the “geopolitical” algos, algos trained or designed to trade geopolitical risk rather than Fed risk, gain in prominence? At exactly the time humans become concerned about this and positioning seems set up to trigger stock losses (sentiment seems to be skewed towards being long stocks and long bonds and neutral energy after that trade struggled much of last year).
Bottom Line
The Times They Are A Changin’ – Change with them! I’m the most bullish I’ve been on energy and energy stocks in sometime (probably toss all commodities into that mix).
I’m the most bearish I’ve been on equities and am targeting 4,500 on the S&P 500 sooner than later.
Credit spreads will widen in sympathy with equities, though this is largely an equity valuation and “set-up” problem (the set-up being the conditioning to lower yields = higher stocks) so credit should outperform equities quite handily here.
On bonds, maybe, maybe, just maybe, we get some “flight to safety” trade, so I’m only mildly bearish on bonds right now, but will sell any rally in bonds as I think the problems facing the bond market, from the geopolitical risk, will outweigh the “traditional” safety bid.
Happy New Year! (sarcasm meter on high).
https://www.zerohedge.com/markets/times-they-are-changin-how-trade-next-algo-shift
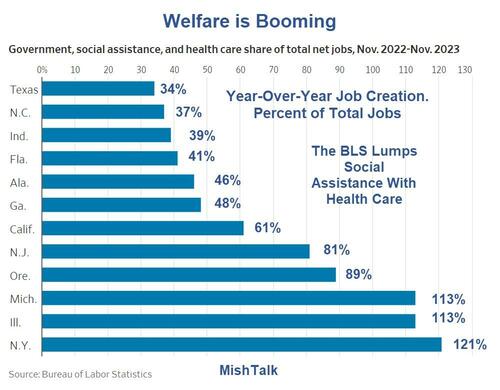
Government, Social Assistance, & Health Is Over 100% Of Job Creation In 3 'Progressive' States
by Mike Shedlock via MishTalk.com,
The welfare state is booming, especially in the sanctuary states. In three states, Government jobs plus Social Assistance/Health Care is over 100% of year-over-year job creation.
Free Money Has Run Out and it Shows in the Polls
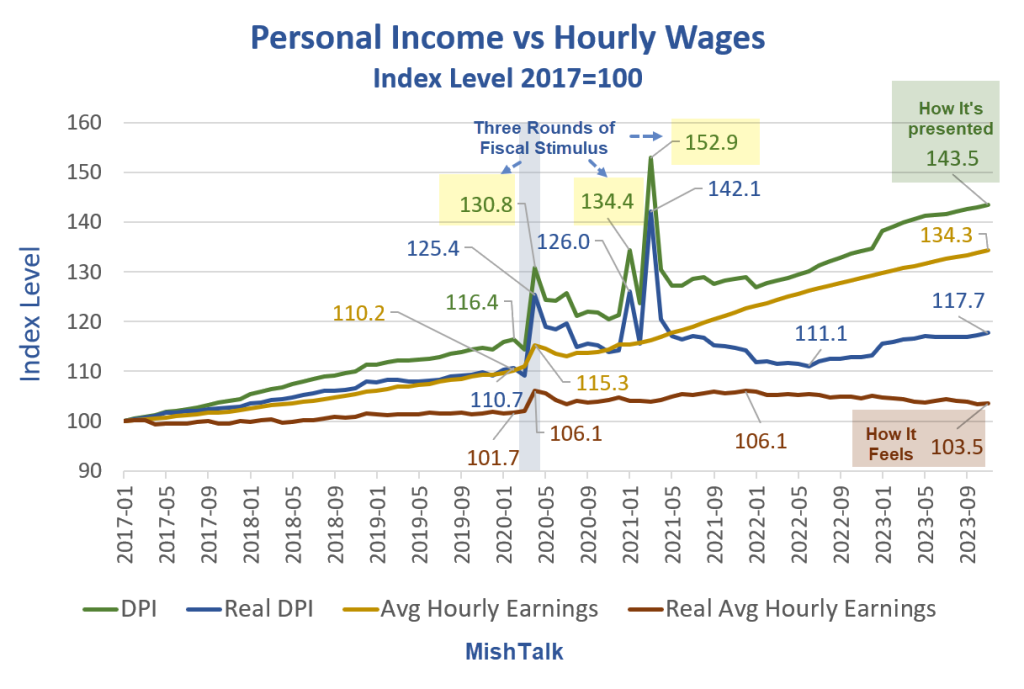
The third and largest round of fiscal stimulus was in March of 2021. That’s when Biden’s popularity peaked at 55.1 percent.

Why Biden’s Approval Rating Is Miserable
Income is rising and so are wages. Even real income is up. But real wages are another matter.

Personal Income vs Hourly Wages Notes
- DPI means Disposable Personal Income. Disposable means after taxes.
- Real DPI means inflation adjusted using the Personal Consumption Expenditures (PCE) deflator. Real DPI is a BEA calculation.
- Average hourly earning are for production and nonsupervisory workers.
- Real wages are deflated by the Consumer Price Index (CPI) not the PCE.
- The BLS does not report a real hourly wage. I used the CPI-W index for production and nonsupervisory workers, produced by the BLS, as the deflator.
Personal Income Definition
The BEA defines personal income as “Income that people get from wages and salaries, Social Security and other government benefits, dividends and interest, business ownership, and other sources.” Rental income is a part of other sources.
Three Rounds of Fiscal Stimulus
- Round 1, March 2020: $1,200 per income tax filer, $500 per child(CARES Act) – Trump
- Round 2, December 2020: $600 per income tax filer, $600 per child (Consolidated Appropriations Act, 2021) – Trump
- Round 3, March 2021: $1,400 per income tax filer, $1,400 per child (American Rescue Plan Act) – Biden
The three rounds of free money fiscal stimulus (literally a helicopter drop), plus eviction moratoriums put an unprecedented amount of money in people’s hands. In addition, unemployment insurance paid people more to not work than they received working.
The third round of stimulus under Biden was totally unwarranted. However, it is also worth noting that Trump wanted a much bigger second stimulus package than the Republican Congress gave him. Trump is no fiscal hero.
For more discussion, please see Why Biden’s Approval Rating Is Miserable in One Economic Chart
The three stimulus packages, on top of supply chain disruptions, energy disruptions due to the war in Ukraine, and Bidenomics in general, set in motion the biggest wave of inflation in over 30 years.
Biden went from an approval rating of 17.2 percent to a disapproval rating of 17.2 percent.
Peak Free Money
In addition to declining real wages, perhaps Biden’s big problem is the free money has run out.
Biden’s popularity peaked in March of 2021 along with stimulus. Was that a honeymoon impact or peak free money?
I suspect a bit of each coupled with hope of more free money, especially student loan forgiveness.
Sending free money to Israel and Ukraine does not help perceptions of how Biden is doing. And neither does the border or ridiculous energy regulations that cost people money.
Biden keeps telling people what a great job he has done.
I don’t believe it and most don’t either. And that shows up in the polls no matter what reason you assign.
https://mishtalk.com/economics/the-free-money-has-run-out-and-it-shows-in-the-polls/
Marinus Prelims, ZTALMY® Net Product Revenue and Business Update
- ZTALMY® (ganaxolone) Q4 2023 preliminary net product revenue of between $6.5 and $6.7 million; full year 2023 preliminary net product revenue of between $19.5 and $19.7 million
- Projected full year 2024 U.S. ZTALMY net product revenue of between $32 and $34 million
- Over 90% of patients required for the interim analysis are now enrolled in the RAISE trial
- TrustTSC trial enrollment now over 70%; enrollment completion anticipated by end of Q1 and topline data anticipated in Q3 2024
- Cash runway projected into Q4 2024 with preliminary unaudited cash, cash equivalents and short-term investments of $150.3 million as of December 31, 2023
Liquidia Corporation Announces $100 Million in New Financings
- Agreed to $75.0 million sale of common stock to fund affiliated with Patient Square Capital in a private placement
- Additional advance of $25.0 million from HealthCare Royalty under current financing agreement
Rhythm Pharma to Acquire Global Rights to Oral MC4R Agonist
Rhythm Pharmaceuticals, Inc. (Nasdaq: RYTM), a global commercial-stage biopharmaceutical company focused on transforming the lives of patients and their families living with rare neuroendocrine diseases, today announced it has entered into a global licensing agreement with LG Chem, Ltd. ("LG Chem"), a leading global company headquartered in South Korea that specializes in life sciences as one of its core businesses, for LB54640, an investigational oral small molecule melanocortin-4 receptor (MC4R) agonist now in Phase 2 clinical trials.


