by Matt Taibbi
Nearly two decades ago, when charged to cover an apparent Depression-level event in the 2008 crash, I was stunned to discover how few resources were available to ordinary people hoping to make sense of the economy. The financial press was written by and for financial professionals, and every time I thought I’d found an analyst who made sense, I’d discover shortly after he or she was funded by banks or hedge funds incentivized to put lipsticks on pigs.
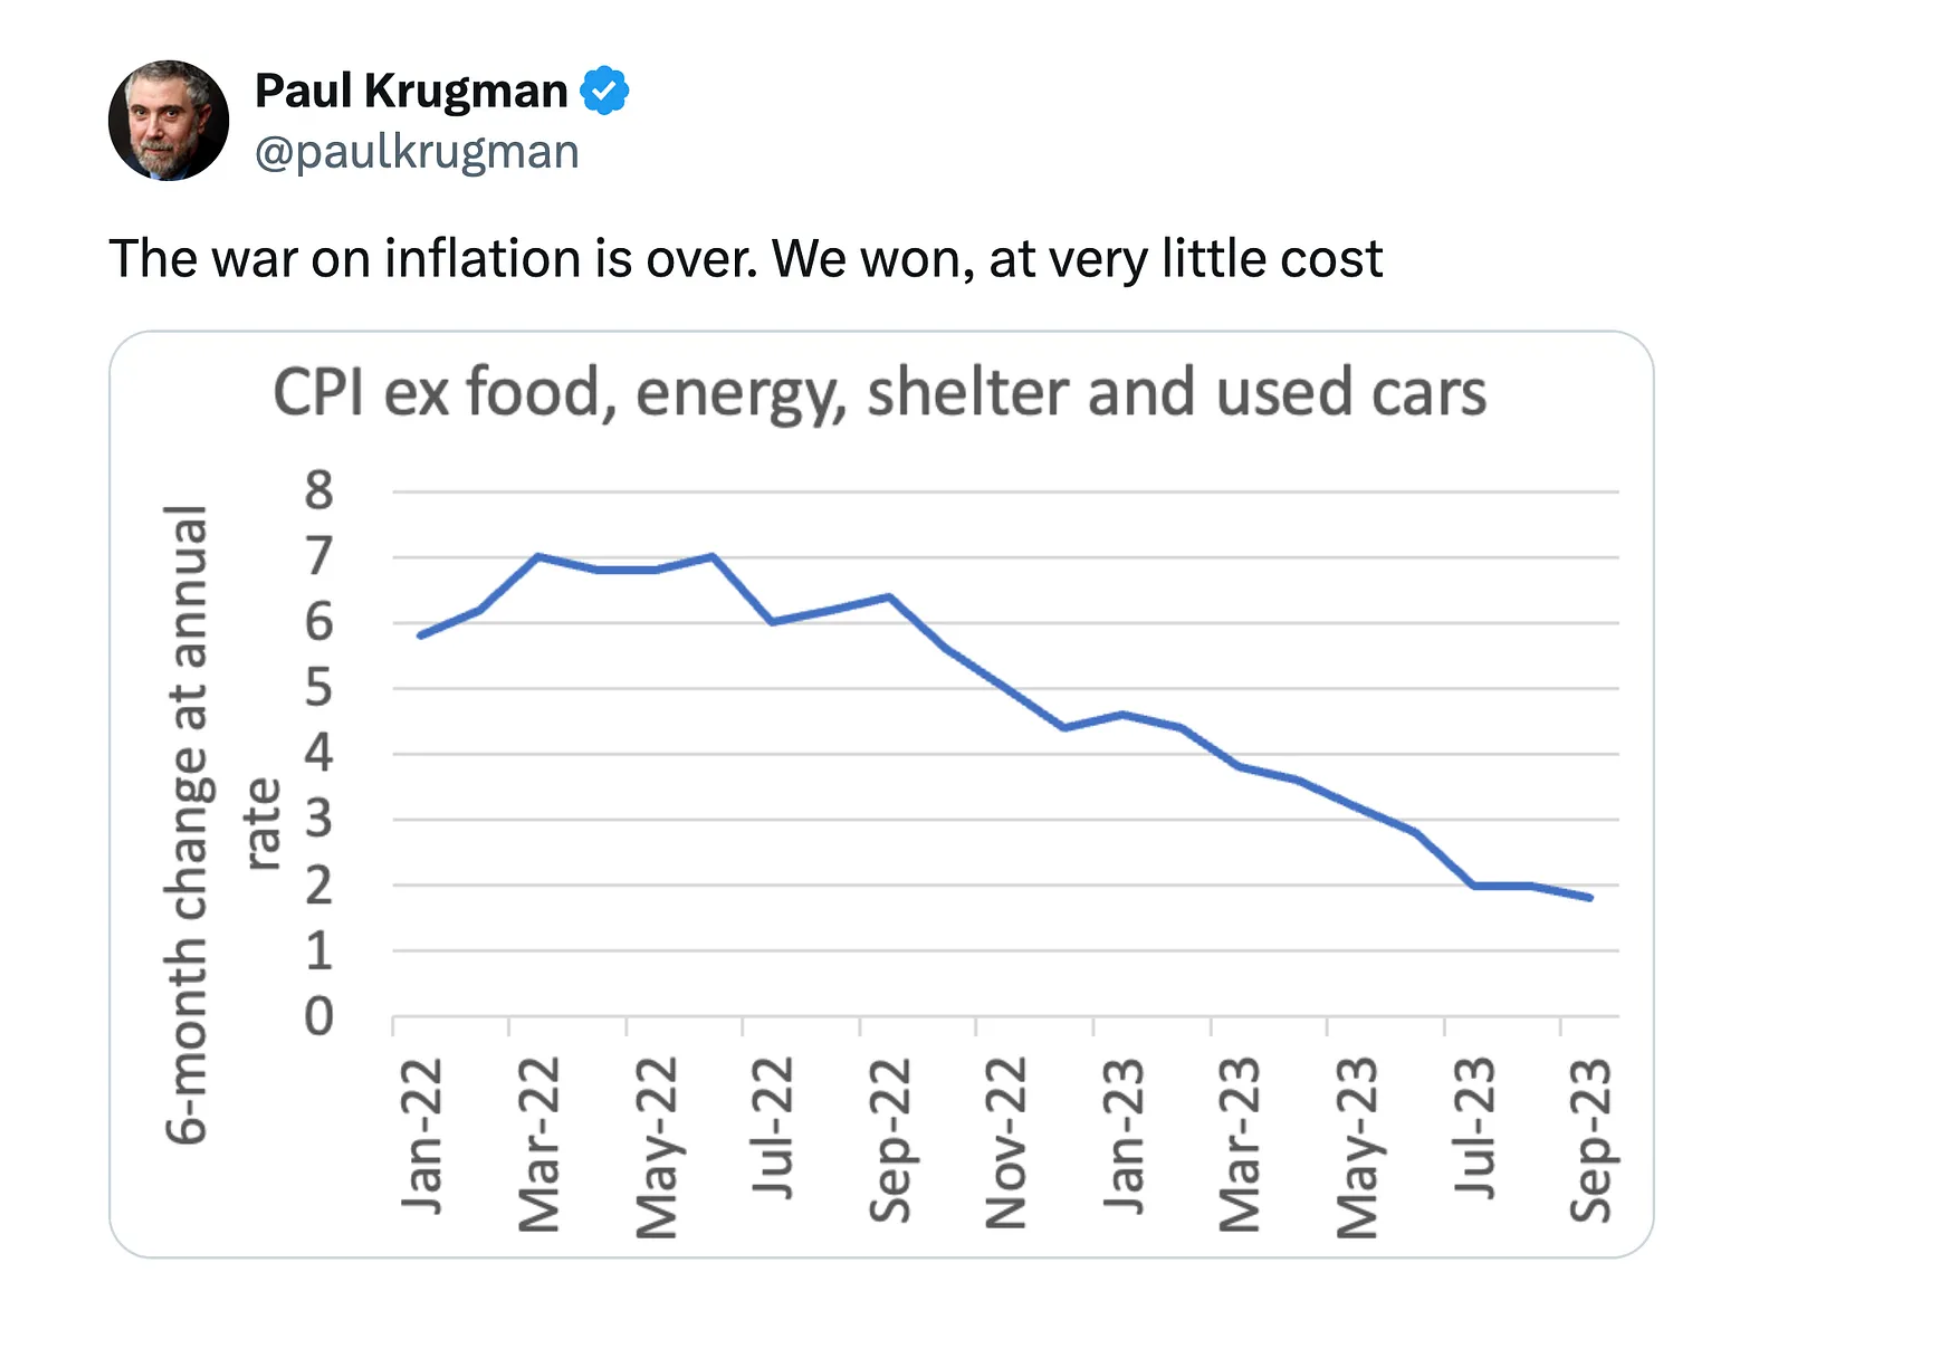
It also turned out that most of the statistics politicians used to represent the relative fitness or unfitness of the economy were and are weighted at best, and outright bull at worst, from the Consumer Price Index to the Unemployment Rate. Even LIBOR, the interbank lending rate that supposedly represented how finance companies thought about the economy, turned out to be a monstrous scam. The habit of tweaking stats became so ingrained, even Nobel laureates like Paul Krugman could unashamedly declare “the war on inflation is over” and “we won, at very little cost” using a graph that charted price growth excluding “food, energy, shelter, and used cars,” i.e. everything:
We’re again in panic mode, with front page charts full of down-pointing arrows, and the word “plummets” suddenly a ubiquitous headline term. However you feel about the new “reciprocal tariffs” program, we’re again entering a time in which most news consumers will need to know where to search for de-politicized answers to economic questions. I polled finance professionals, contributors like Eric Salzman, and reporters who cover economics to ask which sources are most accessible. Then I spoke at length with fellow Substacker Chris Irons of Quoth the Raven about the broader problems with finding reliable economic info, and some sites that short-cut the obstacles.
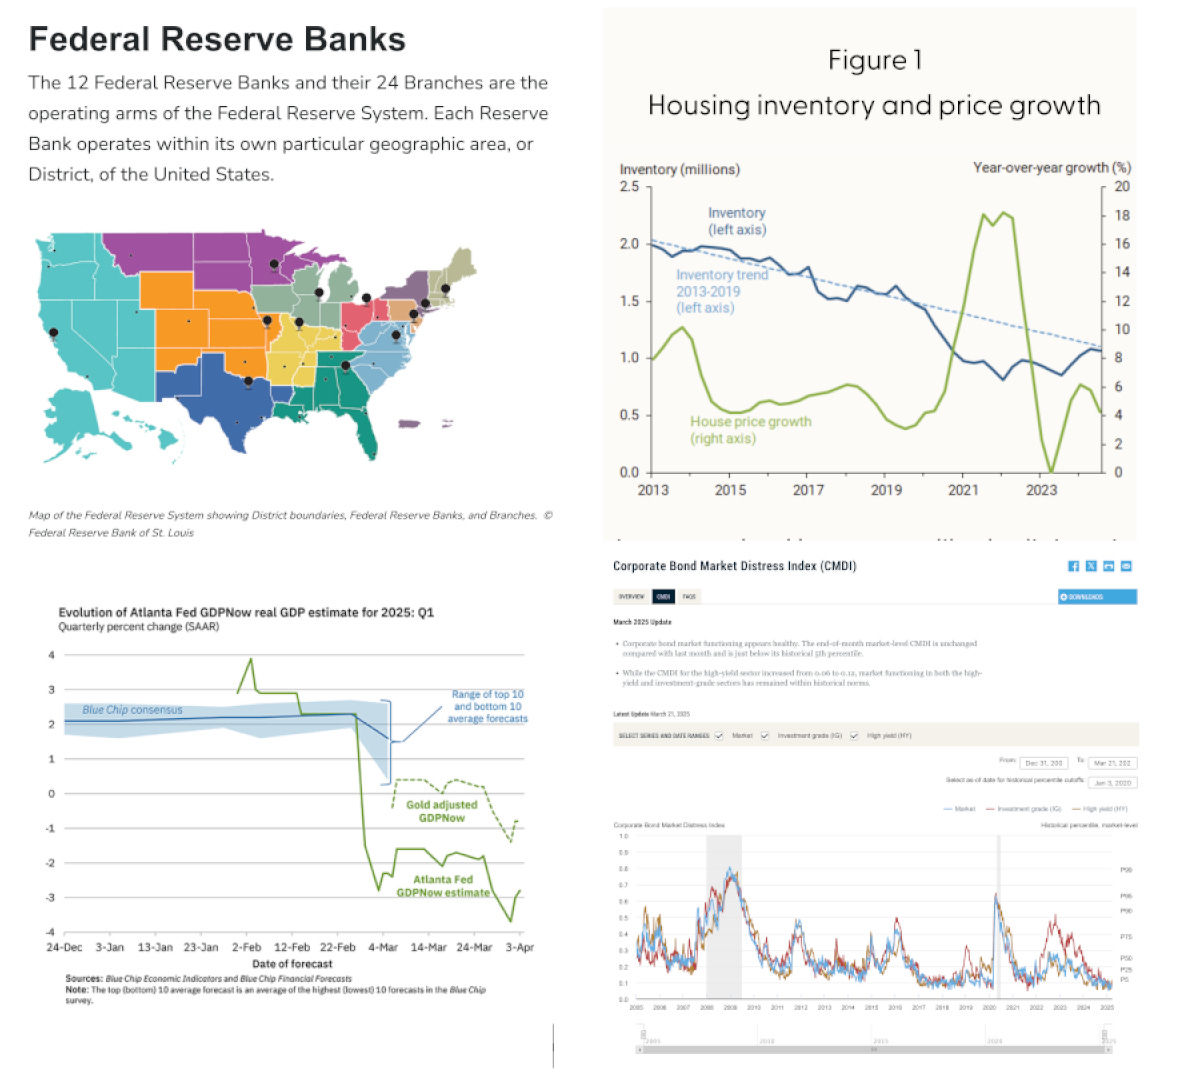
One quick note up front. Many respondents pointed out that a neophyte beginning a journey into sorting out what’s what in the economy may want to begin by familiarizing himself or herself with each of the twelve Federal Reserve banks. “They all pretty much report on different things,” says Salzman. “If you want to know what’s going on in the oil and gas business, the Dallas Fed issues a lot of research.” Irons pointed to FRED, or Federal Reserve Economic Data, put out by the St. Louis Fed. “It’s all there,” he says, noting for instance the multiple official unemployment rates that are often cherry-picked by financial media depending on the situation. “It’s just not what’s in the news.”
Data about Wall Street is found throughout the Fed system, but the New York and Boston Feds put out some of the most interesting numbers and surveys on financial markets. The Atlanta Fed prides itself on forecasting numbers like GDP growth, San Francisco is good for labor markets and Pacific Rim issues, and so on. You can find each bank’s site here, and all of them will have a notation reading “research” or “what we study” at the top.
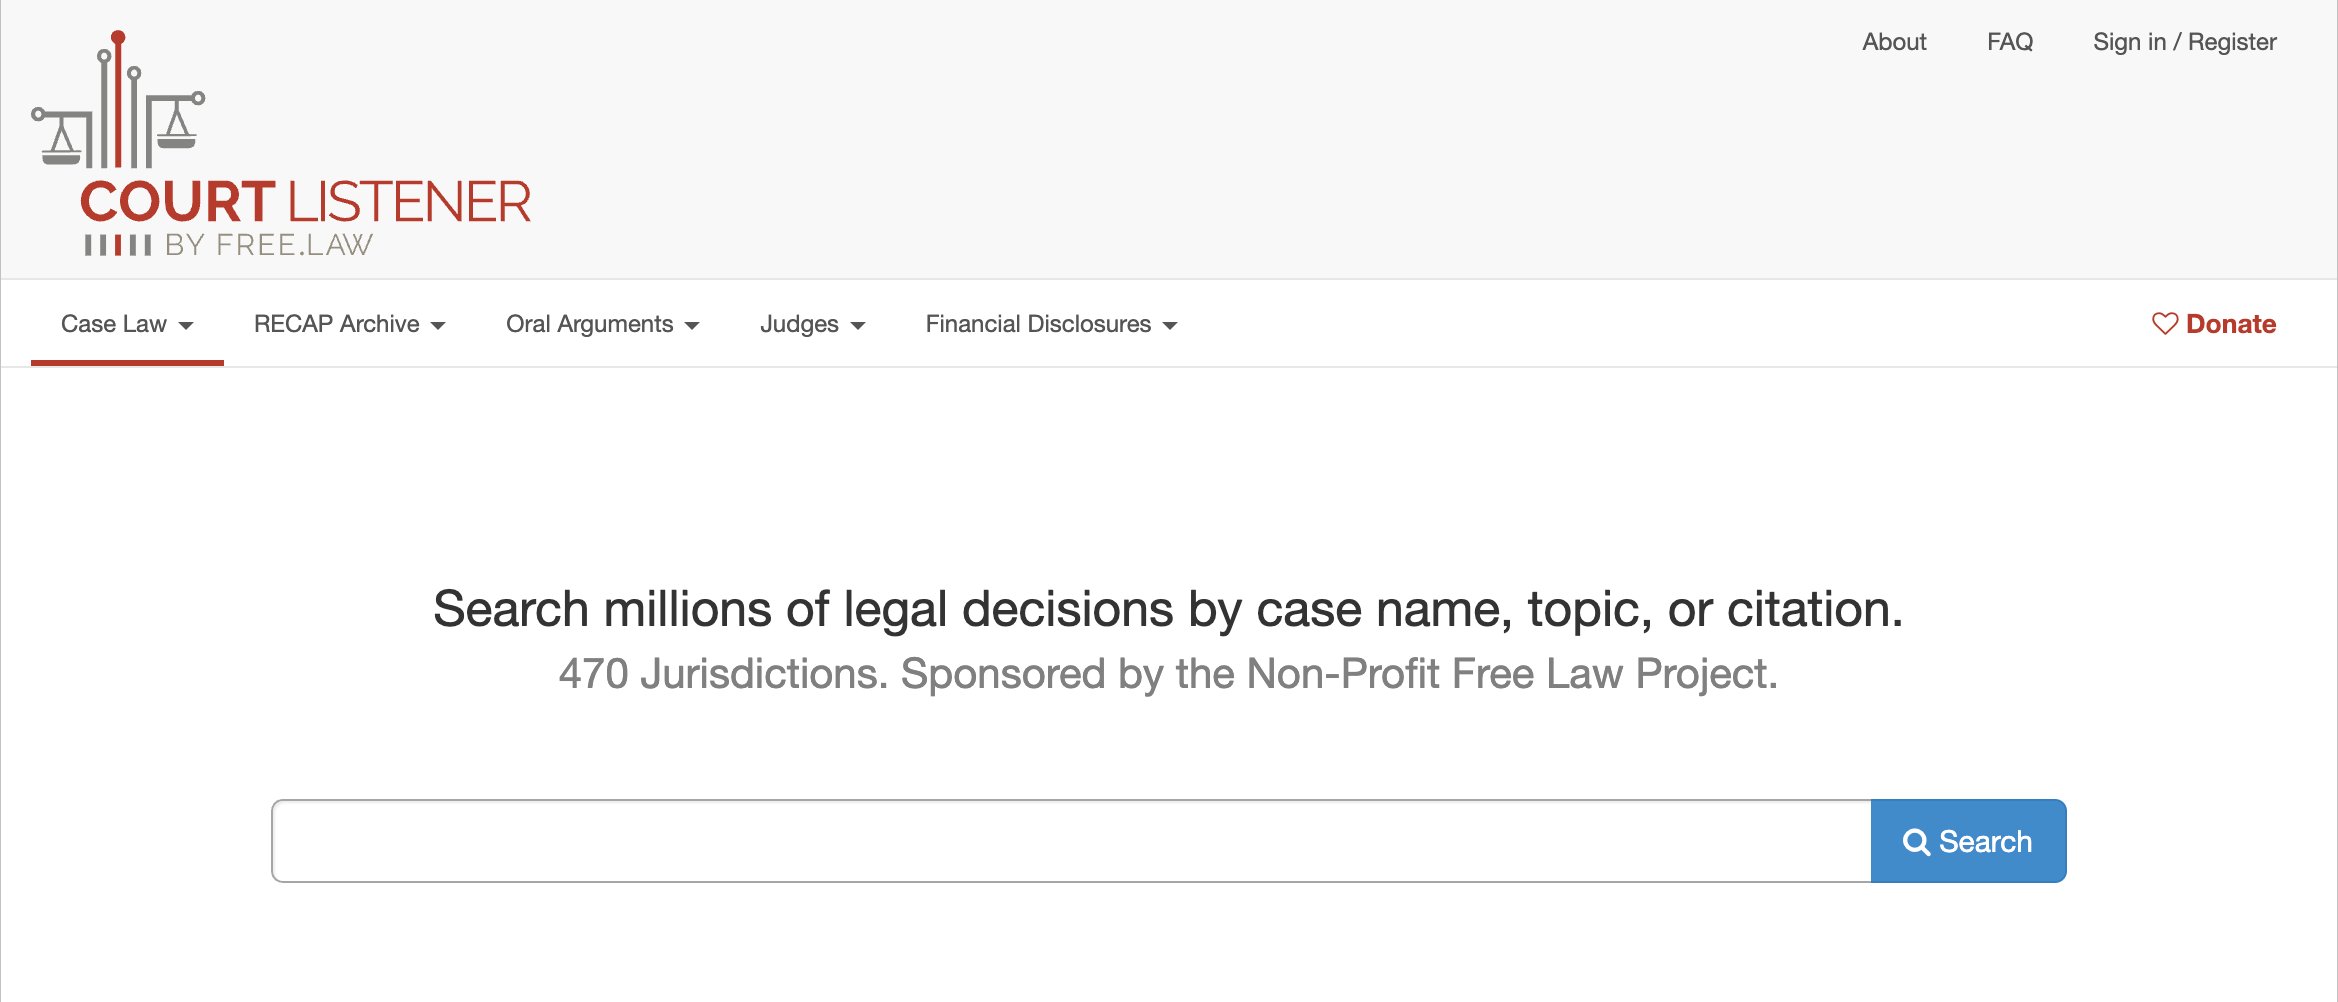
A key thing to understand about economic searches is that governmental agencies (and quasi-governmental agencies, like the Fed) generally have a fair portion of the raw, unmanipulated data you’re looking for, both for macroeconomics and individual companies. The problem is learning to interpret the numbers, and finding convenient ways to locate everything you need in one place. If you’re following economic developments through the courts, costs can be a limiting factor, but as Matt Stoller points out, sites like CourtListener.Com can give you free updates about developments in antitrust cases or other lawsuits.
“If you want to understand important corporate economics,” Stoller says, “the place you understand them is when they’re fighting with each other.”
It’s a big topic, and future entries will probably feature separate articles for independent investors and people simply interested in learning what kind of shape the global or national economy is in from places other than newspapers proven to be unreliable. I asked Irons, whose “The Inevitable, Just Sooner” piece about Donald Trump’s tariff war expresses a lot of my own beliefs about the subject, how and where he goes to evaluate companies and the economy in general:
MT: Putting off macroeconomics for a moment, where do you start when you’re looking at a company?
Chris Irons: Well, the nice thing about Securities and Exchange Commission (SEC) reporting is that if you strip away all of the financial media, the sell-side analyst reports, and what everybody is saying about a given company, at the end of the day, everybody’s beholden to the same disclosure requirements. So there is always a way to make an apples-to-apples comparison of companies.
One company may be earning $20 million a year and be very pissed off about it, and Goldman Sachs might hate ‘em, and another company may be making $20 million a year, and it might be the hottest thing ever, all over CNBC, because they’re in AI or whatever. At the end of the day, if you’re just looking at each company’s 10-Ks.
MT: The annual reports required by the SEC.
Chris Irons: Right. So you’re looking at $20 million on either one, and then it’s up to you to determine where that sits within the industry that the company’s in. So one thing you can do is compare companies to their peers, obviously, which is what everybody on Wall Street does, and then kind of work your way out to the overall sector in general: “Okay, is this an auto stock? How is the whole industry doing?” Then work your way out even a little bit more to the macroeconomy.
MT: All of this is searchable at SEC.gov, right?
Chris Irons: Yes. You can go in there, there’s a search filings page, and just enter any company, if you want to use the official sites.
MT: There’s a nice clip-art picture of “you” frowning a little as you tackle the page:

MT: Anyway, there are all sorts of mandated disclosures in these documents. What are some of the most important?
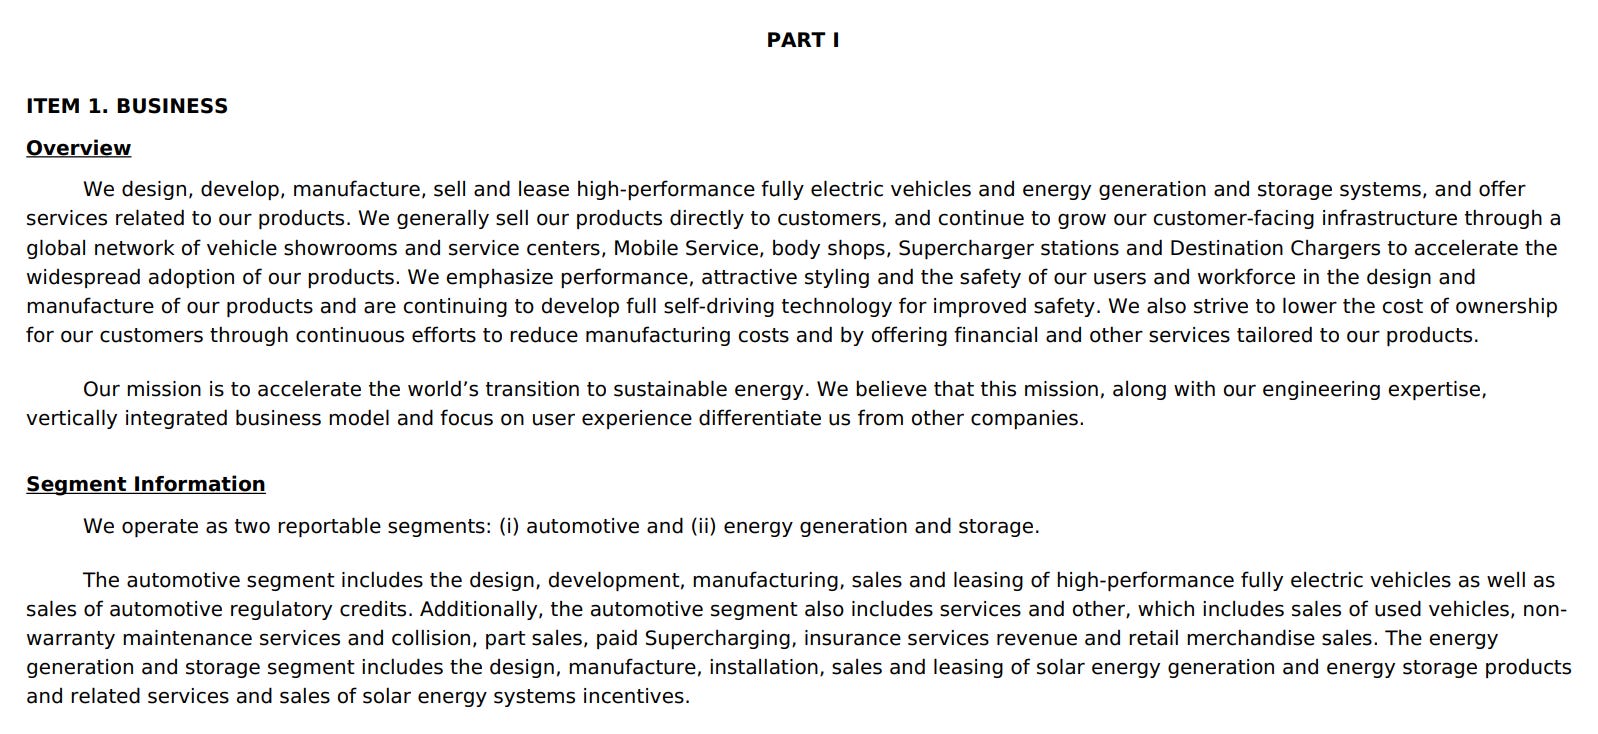
Chris Irons: Literally reading a 10-K from start to finish is the best way to learn about a firm, especially if it’s just fresh off the press and you’re not two months into a new quarter. But when a 10-K or even a 10-Q [eds. note: the quarterly version] drops, that is really the best way to familiarize yourself with the basics of a company. They all start with, “What does the business do? What’s the name of the business? What’s the address? Where are they headquartered? Here’s the business that we’re in. Here’s the industry that we’re in, and here’s what the segments of our company are, so here’s where revenue is coming in.” So we may be Disney and we may have theme park revenue, video content, revenue, licensing revenue.
MT: They’re telling a story about how they make money.
Chris Irons: Right. How they make money, and if they don’t make money, how they expect to make money.
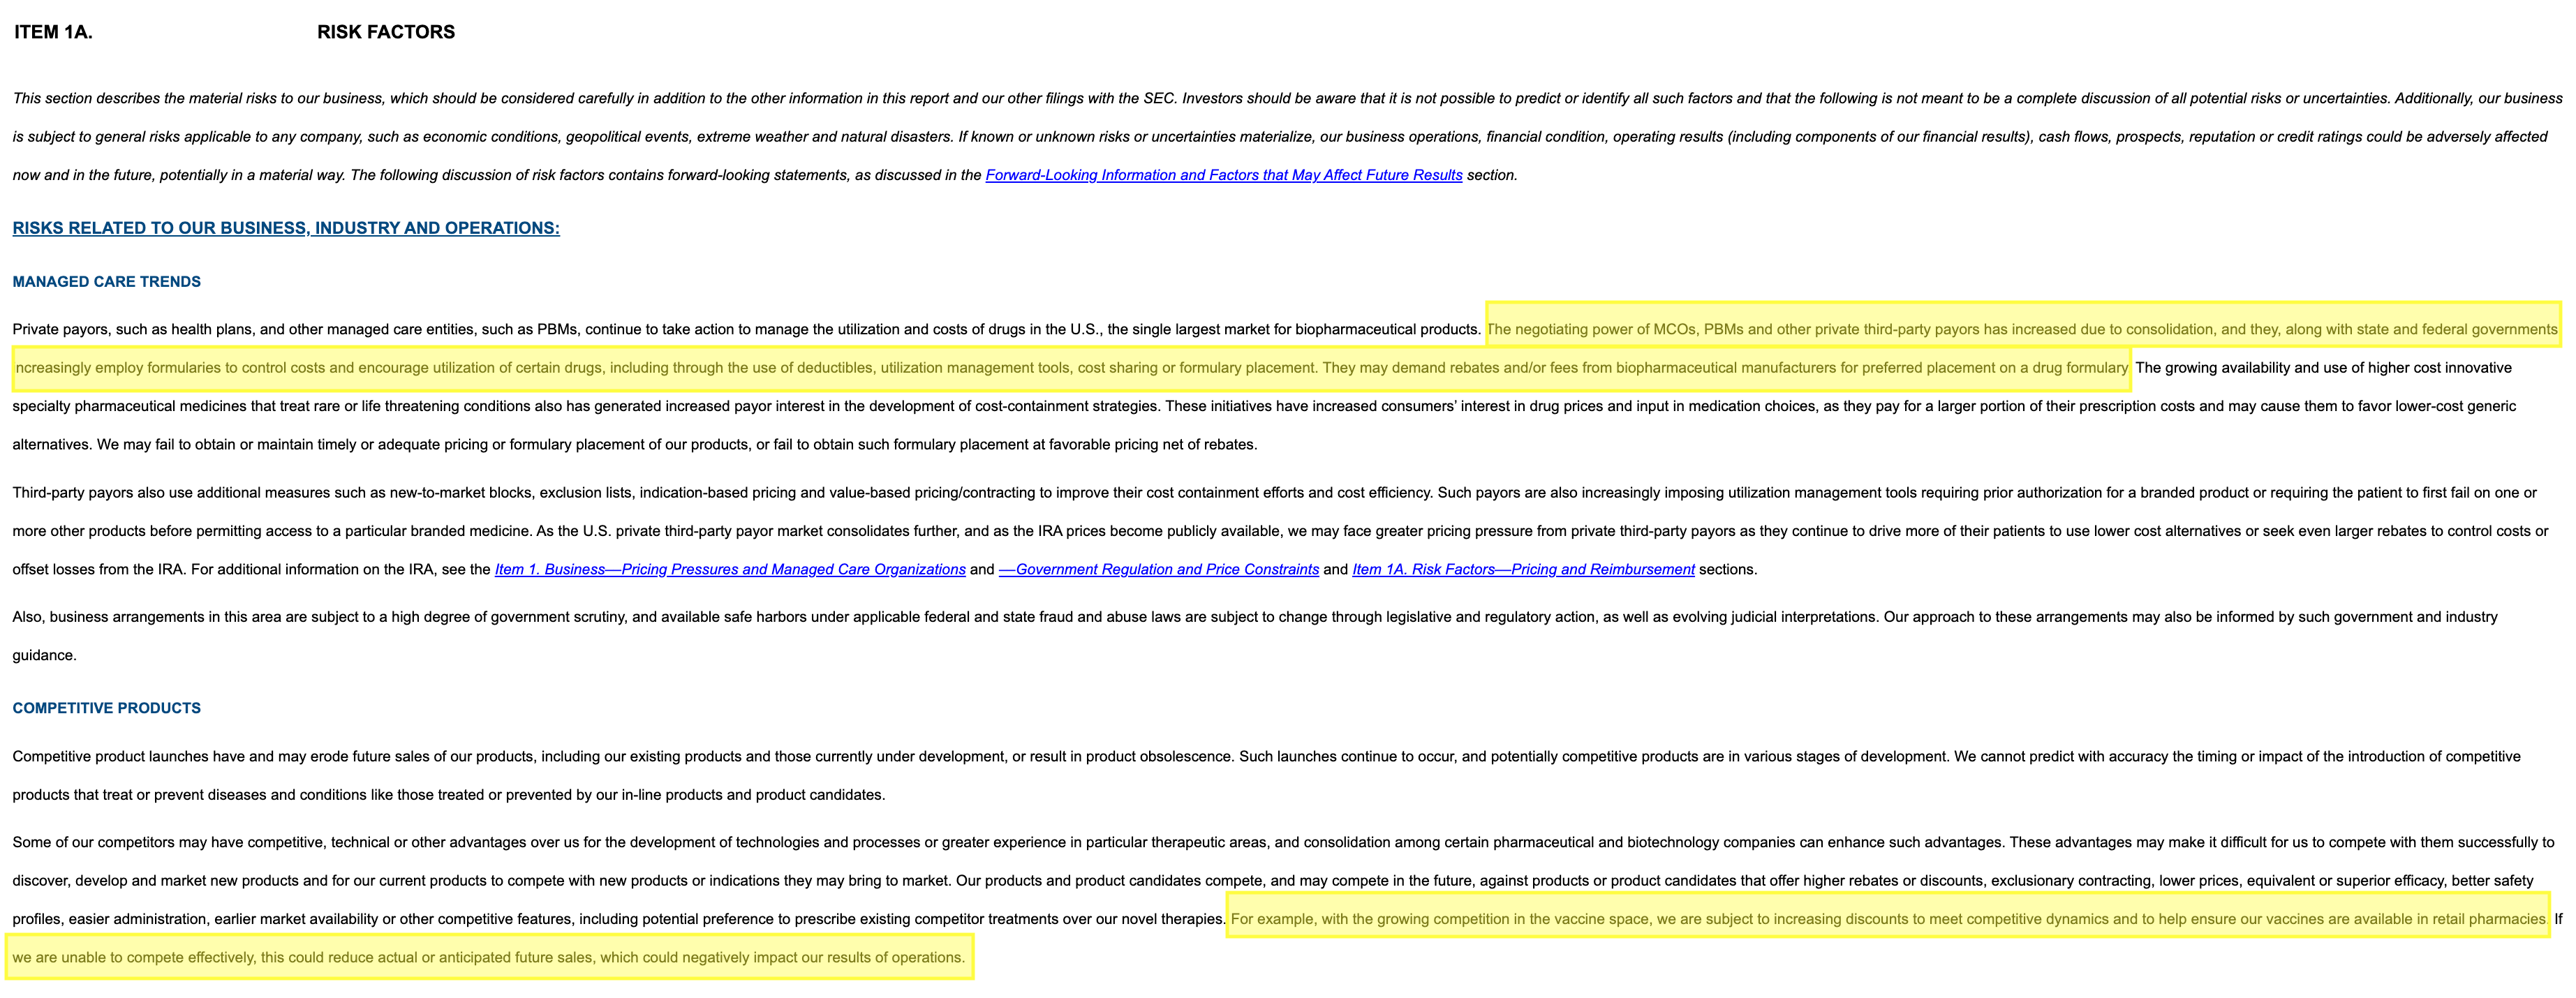
Now, the best way to cheat if you don’t even want to look at the financials, say you don’t know anything about accounting, is every company has a risk factor section. The rule of thumb with risk factors is you always put the most materially important risk at the top.
So if you have a “key man” risk where one guy knows the secret sauce and if he dies, you’re completely fucked, that’ll be up top. Or if it’s that you’re losing money as a cash burning biotech company that’s trying to push one drug through phase three, the first thing that they’re going to say is, our ability to operate is contingent upon our ability to raise capital. And that business could fail or be adversely affected if the phase three drug doesn’t go through or it doesn’t meet its primary endpoints. So the risk factors are often kind of overlooked as boilerplate, but they’re there for a reason.
I’ve been in the room with securities lawyers and executives as they write them, they’re worded purposefully and they’re written with great care because in essence, that is a way for the company to disclaim itself from future risk that an investor may say, “I didn’t see this coming.” So they do want to be forthcoming.
The problem is that nobody reads the 10-K. Everybody glances over it and they just say, okay, well this is just boilerplate lawyer bullshit. Well, it’s actually not. It’s actually the worst case scenarios that you can find. So that’s a great spot in an annual report to look at that. Most companies don’t look at that. If you turn on CNBC or you read a sell-side analyst report, they’re not going to go into depth about the risk factors.
MT: It’s one of the few places in America where people are required to be at least somewhat painfully honest in advance.
Chris Irons: Yeah. And some sites actually make it even a little bit easier. There’s a site that I really like that I’ve used for the last 10 years. It’s called BamSEC.
MT: Okay. Never heard of that. And it’s going to give you access to the same filings.
Chris Irons: It just organizes them a little bit. The SEC site is a bit convoluted, it’ll kind of give you a list of everything. In BAM SEC, you put the ticker in and immediately in one section of the screen you have your 10-Ks and your 10-Qs. Mostly they’re material events that occur to the business in between the periods of 10-Q. So if you just filed your quarterly and two weeks later your CEO resigns, that goes out in an 8-K, for foreign filers.
Then one section has insider buys and sells, which will be on Form-4s and Form-3s. Form-3s are your initial statement of beneficial ownership and Form-4s are when insiders transact in the stock. I think they’ll put the 13-G and D filings in there too, which is when you have outside investors come in and acquire a big enough stake in the company, where they have to disclose, “Hey, I’m a 5% owner.” This is actually what the SEC is going after Musk for right now.
They’re saying he didn’t file that when he needed to on Twitter. And then there’s another section of the page where you have the proxy statements and some other stuff. You’ll get a lot of the same information that you get in the annual reports, but you’re also going to get a lot of detail about the board of directors, the biographies of the people that are on the board of directors, the different committees within the board of directors.
So BAM SEC just lays that shit out. Everything’s dated, so you know what the most recent filing is.
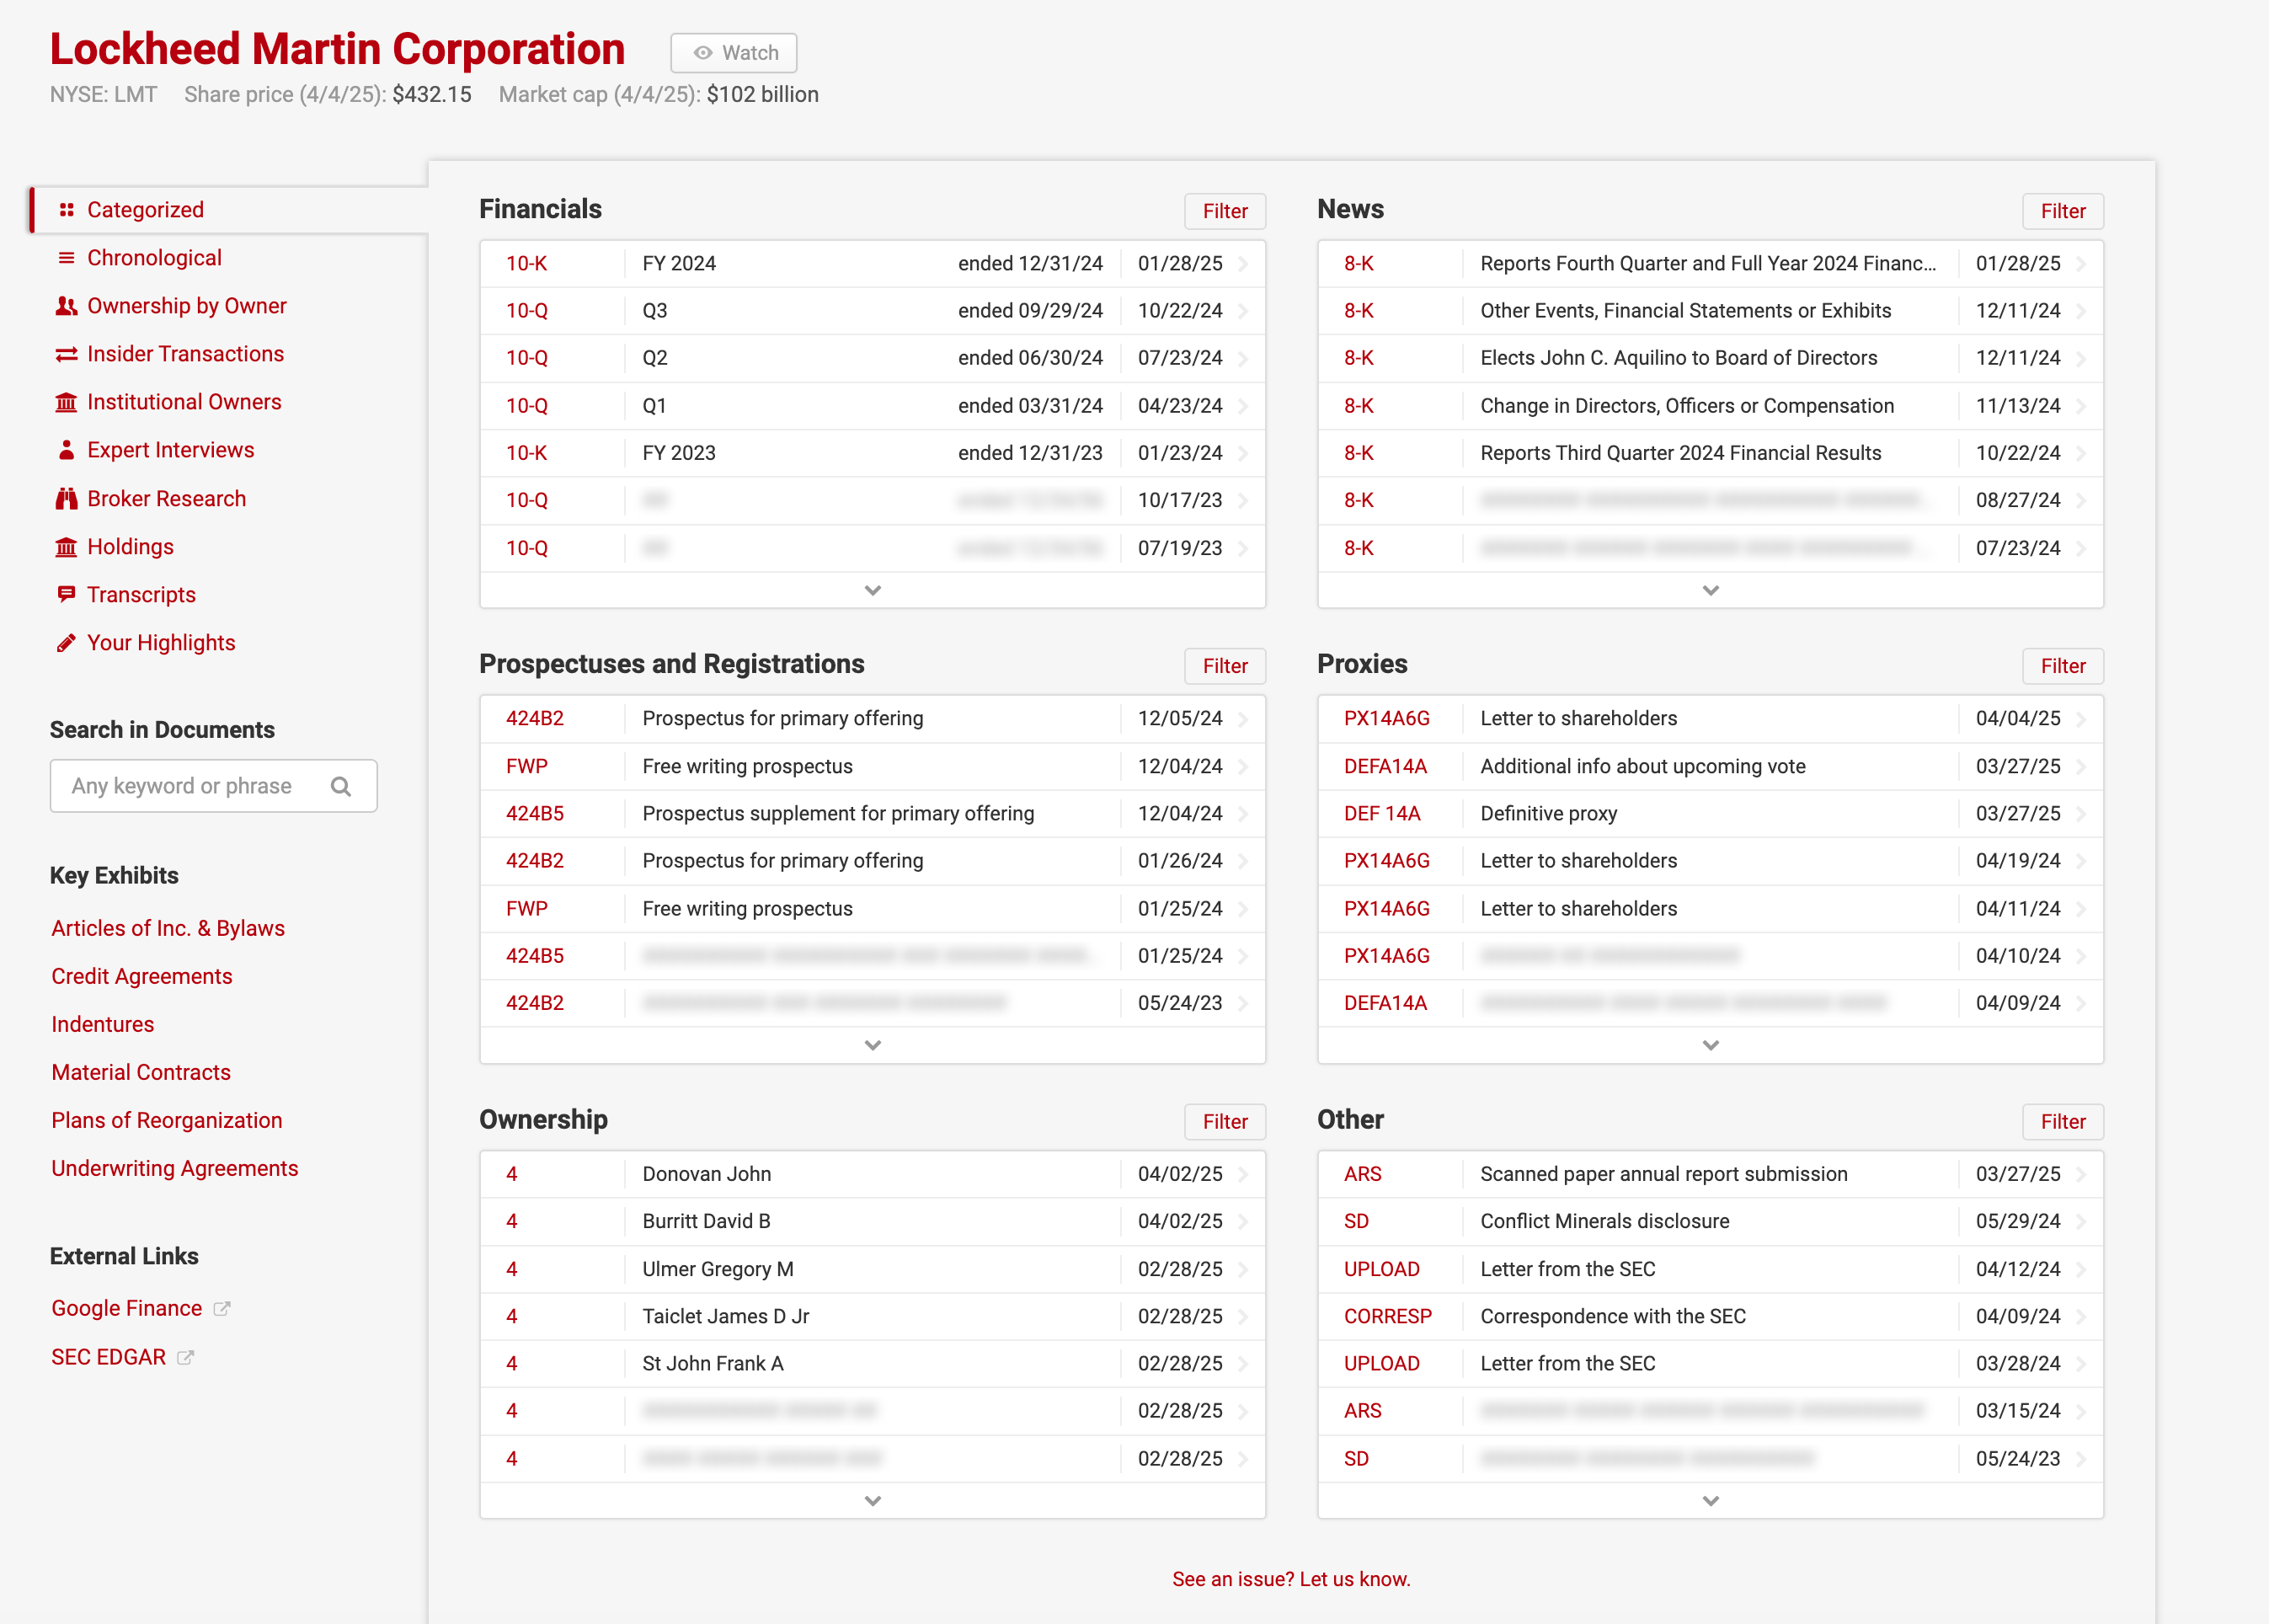
Chris Irons: There are a lot of really nice features on this site. You have correspondence. These are comment letters going back and forth to the SEC. So you can read those and see kind of what the SEC is asking them about.
MT: Cool.
Chris Irons: Yeah, ownership, which is your Form-4s, and again, your 13 Ds and Gs, and then prospectuses and registrations, which are documents related to selling stock to raise capital generally.
MT: Like securities or bonds or anything of that sort?
Chris Irons: Yeah, exactly. If they’re going to go out and sell convertible bonds or they’re going to sell stock, some administrative stuff, prospectuses - also, proxies will have an immense amount of information in them. A lot of the information will be repetitive, so you’ll see stuff that is in the 10-K, but say two months later, a company wants to go sell a million shares to raise 50 million, they have to once again disclose all that shit so that people that are participating in the purchase of the securities are aware of everything that was in the 10-K. So you’ll get a lot of redundant information. But for example, if you have a prospectus that was filed yesterday and the 10-K was filed two months ago, you may get more updated information in the prospectus.
MT: So the average person, if they pick up the newspaper, the information they get about whether we have a good economy or not is going to be unemployment rate, inflation, where the stock market is, and maybe something like the consumer price index. What other things should people be looking at?
Chris Irons: Well, I think people at first need to understand that those statistics in and of themselves are gamed.
For example, the CPI uses things like owner’s equivalent rent and hedonic adjustments where they game the numbers to be significantly lower than they are, which is why you kind of notice things going up 10% a year price-wise, while they’re telling you they’re only going up 3% a year.
There used to be a great site called the CHAPWOOD Index, which looks like they may have stopped in 2023, but the idea here is to kind of show you the true cost of living increases. And what they do is they take a basket of items similar to the way that CPI does it, but they include items that CPI strategically excludes and they don’t make adjustments. CPI makes an adjustment like this: if the price of TVs goes up year over year by 10%, but your TV can now stream video when it not used to not be able to do that, they will go in and discretionarily edit the true cost of what a TV costs because you’re theoretically getting more than what you would’ve gotten last year.
MT: Because it’s more awesome now!
Chris Irons: Yeah, exactly. Those are the kind of bullshit games that are in these numbers. There’s a cool little link on this site that just says problems with CPI. It’s on the CHAPWOOD index site, and it just says the government’s been artificially deflating CPI to keep figures as low as possible.
And that’s because things like social security are all earmarked to the rate of inflation. So people would be shitting a brick if they knew inflation was 10% and the government’s cost of living increase for social services was trying to meet this 3% CPI number. And it’s the same with unemployment. There are huge differences in the way unemployment numbers used to be reported, versus now.
Unemployment used to just mean people who were out of work. Now the unemployment numbers are excluding the people who are actively looking for a job. They do shit like this. Peter Schiff has a great series on problems with the unemployment number. I’m going to see if I can find it. The U-6 rate is what? Prior to 1994, the U-6 rate was the official rate, and that’s what you should get in there because they don’t use the U-6 rate, they use a different rate now, the U-3 rate.
MT: So they went from a higher calculation to a lower one in 1994?
Chris Irons: Yes. It’s the Bureau of Labor Statistics. This is how they fucking release the numbers. U-1 is people unemployed 15 weeks or longer as a percent of the civilian labor force. U-2 is job losers and people who completed temporary jobs. U-3, total unemployed as a percent of the civilian labor force, which is the official unemployment rate. And U-6, which is total unemployed plus all people marginally attached to the labor force plus total employed part-time for economic reasons as a percent of the civilian labor force, plus all people marginally attached to labor force.
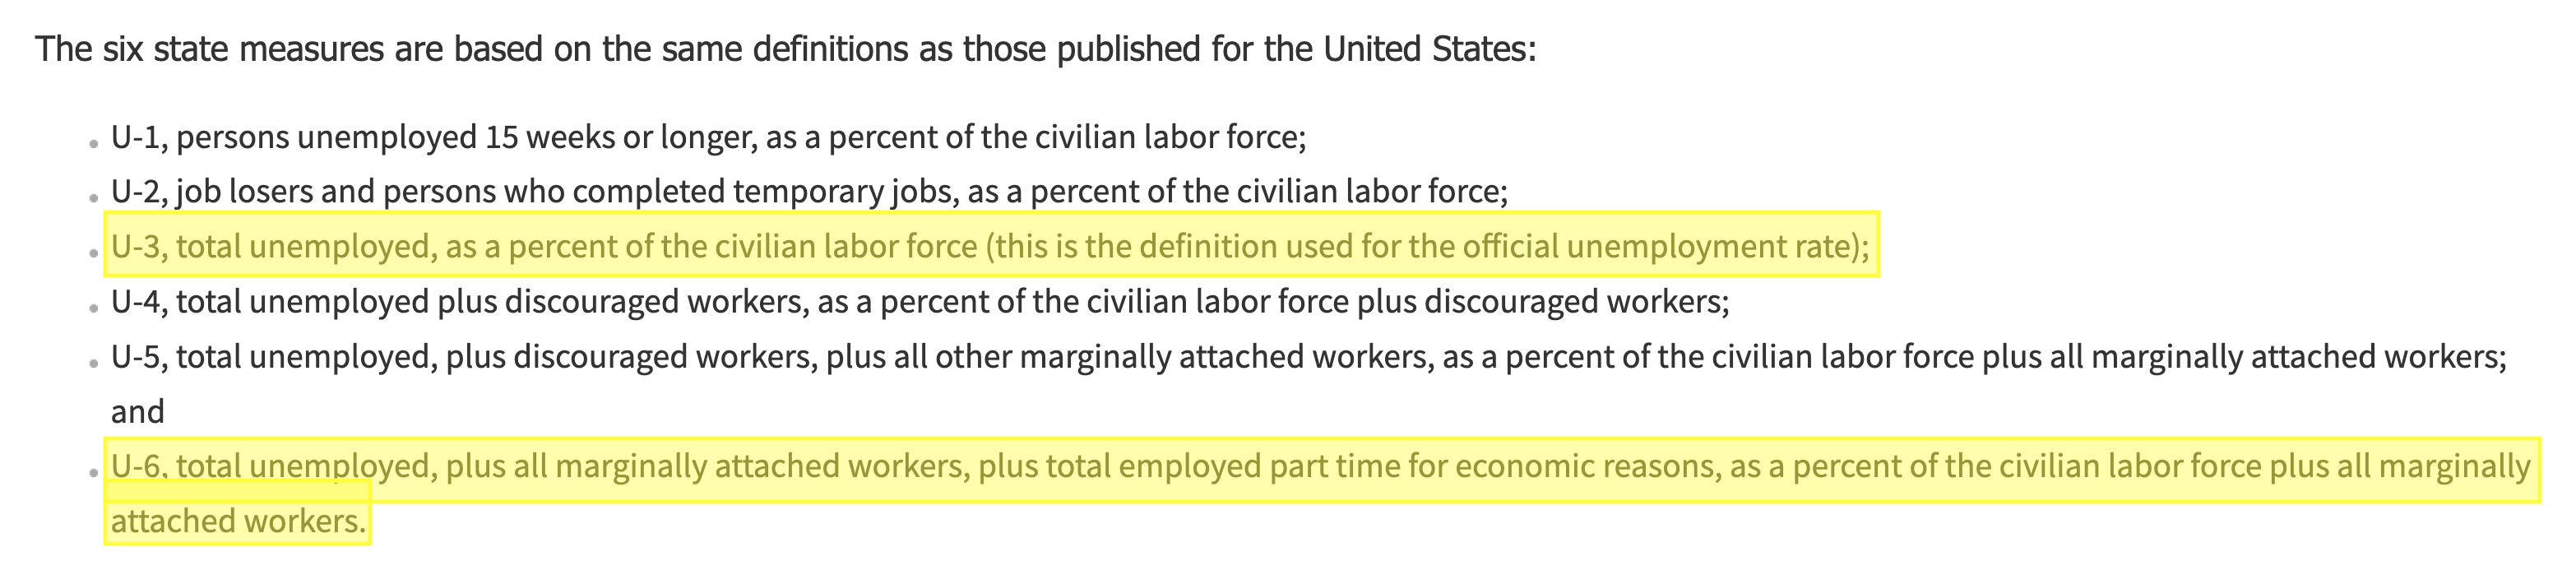
So just cast the net a little bit wider, and it used to be the employment number that they use. Now they use the U-3 rate, which is a smaller pot of people. So they’re data-mining essentially.
MT: Gotcha. What other data might be of interest to an ordinary person? The Fed obviously puts out all kinds of papers.
Chris Irons: The size of their balance sheet. I find it fascinating.
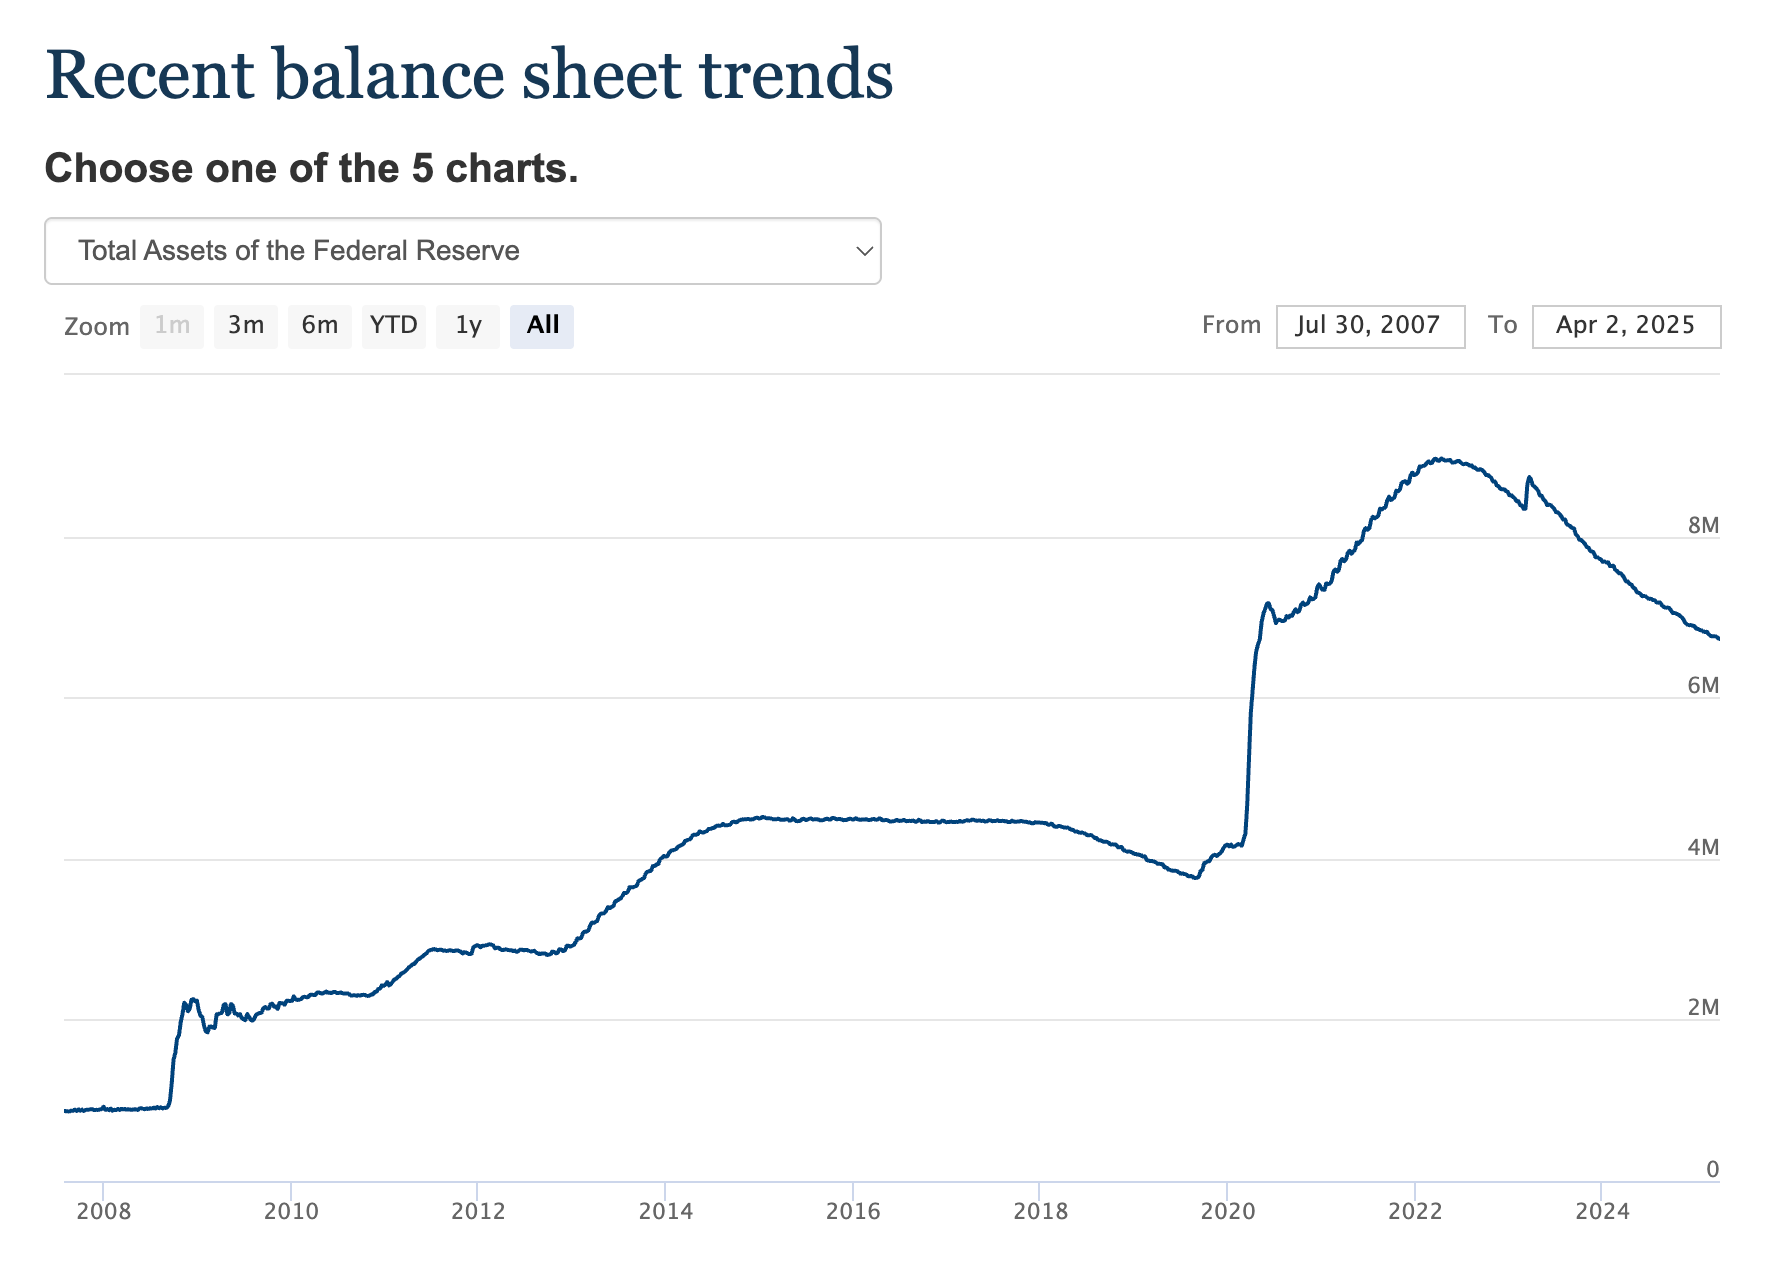
When they started quantitative easing, the idea was they were going to buy some bonds and then they were going to sell ‘em back into the market. And that never happened. They just started buying bonds and now the Fed balance sheet is whatever, seven or 8 trillion, and at some point something’s going to give because they have 7 trillion worth of - I don’t know if they’re subprime assets - but they’re assets that if they went to go find a market to buy them now wouldn’t be there.
Monetary policy, the way that we’ve run it really since the 2000s, is just kind of this big unprecedented experiment and nobody really knows how it’s going to end. You have financial PhDs basically claiming that we’ve figured out the secret sauce, that we can twist and distort and micromanage the economy to get it to do whatever we want at any point that we want, and that this is the path to utopia. And then you have the free market people that say maybe it’s working now, but every day you fiddle around with this bullshit more, the worse it’s going to be when the reckoning comes. I actually just wrote an article about this last week that shows that one of the negative consequences of monetary policy now is this widening inequality gap. So if you go to my substack and you look at the dark secret behind Democrats’ economic policy, which should be the pinned number one, and just scroll down to the chart that says net personal wealth.
MT: Okay.
Chris Irons: So both parties are guilty of this, but I’m writing specifically about Democrats because they’re the party that sells equity and equality and not just equality of opportunity, but equality of outcome. This is the result of the monetary policy that this country has, which is not that the gap between the top 10% and the bottom 90% is widening, but it’s accelerated. And so it’s not just all of this wealth that they’re accruing, because with wealth comes power and influence. It’s within this very same system that Ben Bernanke once said we can print money at no cost, meaning it doesn’t cost anything to run the fucking printer. It costs 2 cents of electricity, but the long and short of it is there’s real cost and this is what the real cost looks like.
Looks like the fucking ultra rich that these dildos are railing against on a daily basis getting exponentially richer and at the same time bringing with them a quality of life by virtue of osmosis. Because as this is occurring, inflation is worsening. And so these people in the top 10%, they don’t feel anything. The people in the bottom 90% are being brutalized, brutalized because the people on a shoestring budget are going to the store. And when they used to get 16 ounces of Fruity Pebbles for $4, now it’s $8 and they only get 10 ounces.
That is a fucking big deal for some people. You know what I mean?
MT: Sure.
Chris Irons: That multiplied across all discretionary spending and especially consumer staples is where it hits these people. And so it’s no surprise to me that Nancy Pelosi thinks that the economy’s working fine or that any of these rich fucks throw a dart. They all think everything’s working. But that is this chart. If everybody understood what was in this chart, people would be raising a lot of serious fucking questions about monetary policy because this takes everything the Democrats talk about and all the virtue signaling bullshit about equity and bringing people together and we’re all going to sing Kumbaya and everybody gets a chance - and refutes it directly. And this happened under both parties.
MT: Alright, are there other sites like that that you can think of that might not be known to the average person?
Chris Irons: Another great site that I really like is called currentmarketvaluation.com.
MT: Sounds self-explanatory.
Chris Irons: It’s super easy. If you look at something like a price-to-earnings ratio, that’s essentially the most commonly used way to determine whether stocks are expensive or cheap. You have to compare them to something, whether that’s the historical average or the industry or whatever. But this gives you that in a couple of different ways to value to market.
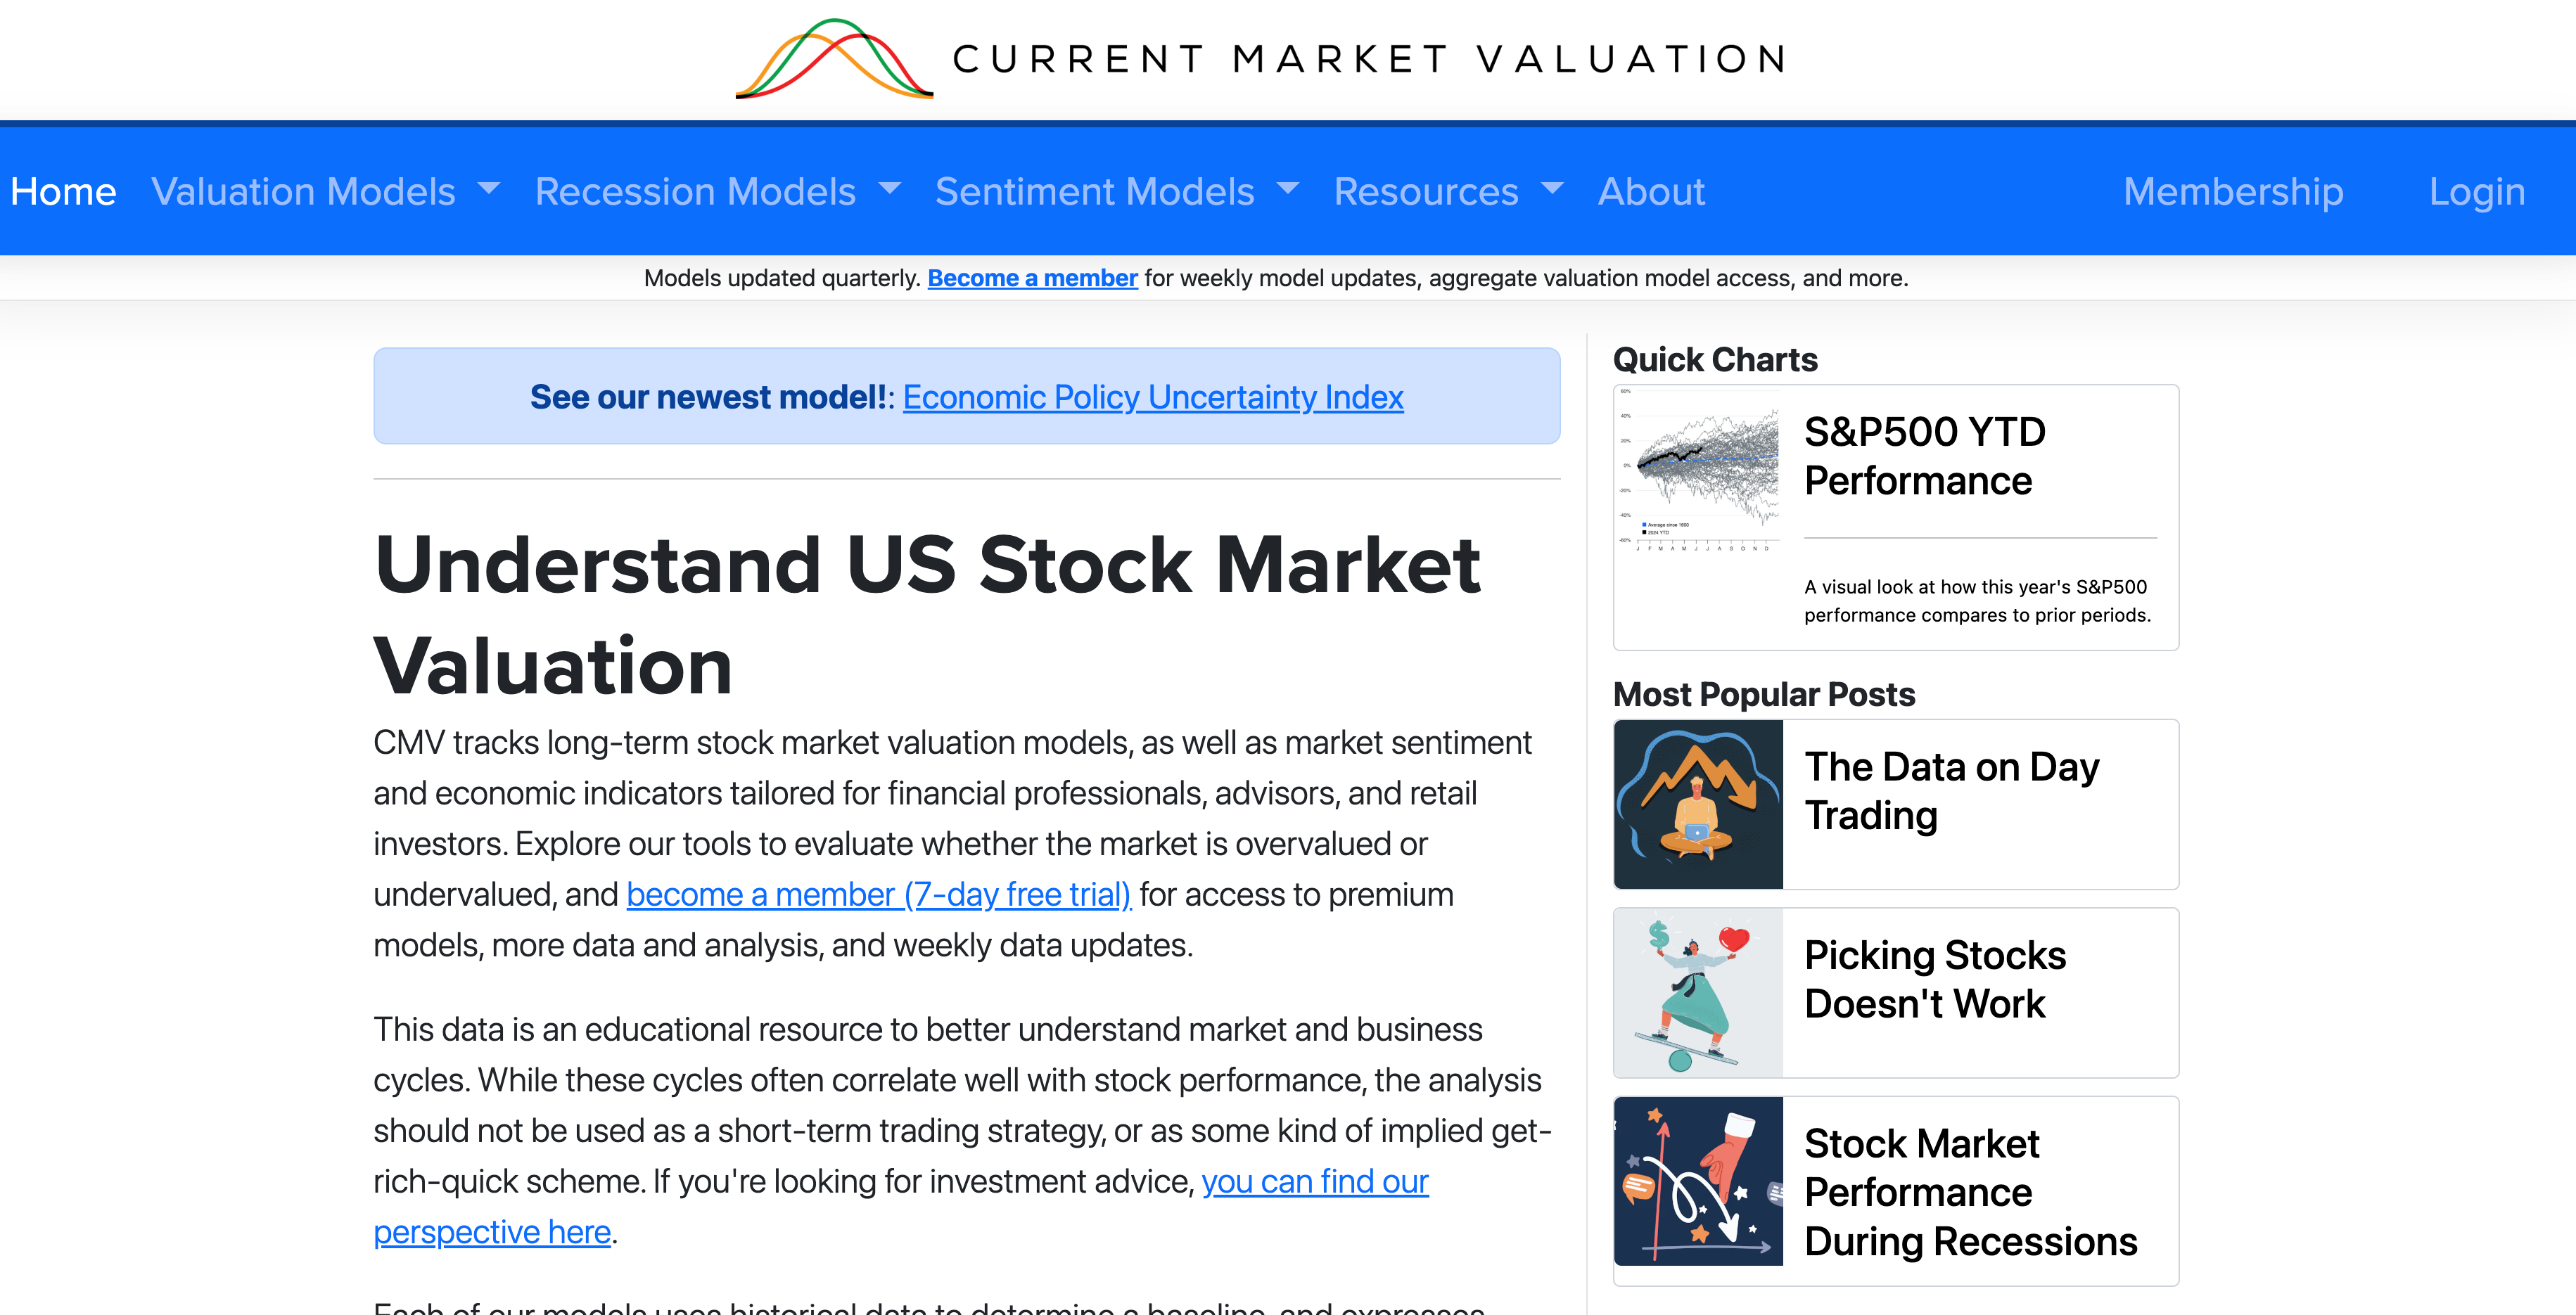
Chris Irons: So if you scroll down, you see where it says market valuation models?
MT: Yes.
Chris Irons: This makes things super simple because it’s telling you right up top that things are strongly overvalued.
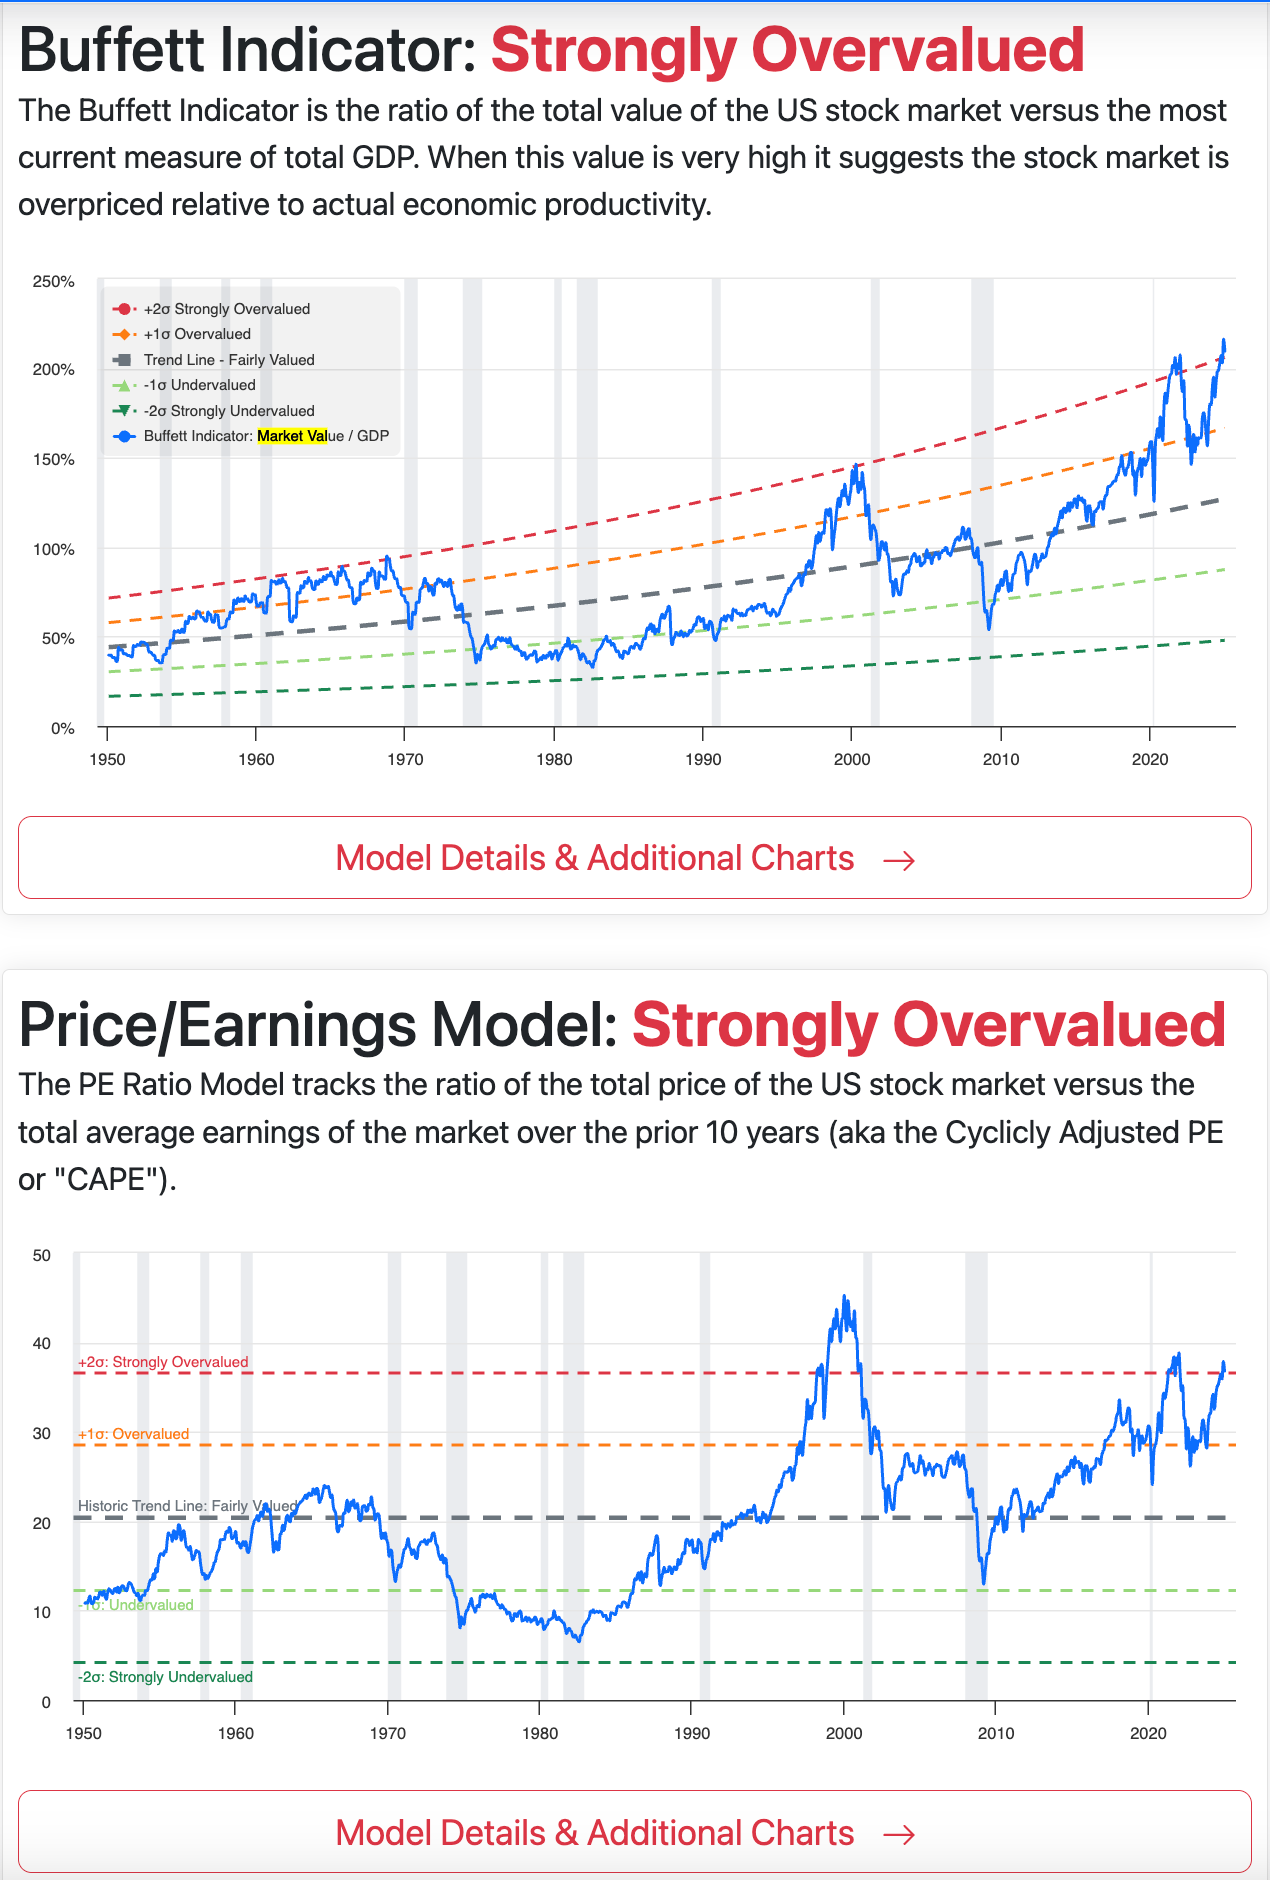
Irons: What it’s showing you there is how many sigma deviations it is away from the historical trend line. The Buffet indicator is market cap to GDP, which is what Warren Buffet has said in the past. It’s his favorite indicator, which is hilarious because three or four weeks ago, there was a big mystery, like, oh, why is Warren Buffet in all this cash? Why does Berkshire Hathaway have all this cash? It’s like the fucking indicator is called the Buffett indicator, and it’s two sigma deviations above the trend line. So his favorite indicator is screaming that the market is overvalued, and then you have your price-to-earnings model. You don’t even have to look at the rest. Those are two great ways to value the market. Market cap to GDP is perfect for the overall market. Price-to-earnings can be used for companies as well, and what I think is really important is that people see a stock go from 200 to a hundred. So they think it’s cheap because it’s 50% less than it was. Price means almost nothing. I mean, it’s a function of a company’s valuation, but when you’re trying to determine whether or not a company is cheap or it’s expensive, what you should be looking at is the multiple.
And the multiple is how many times the current or next year’s earnings does the market trade at. Now when we’ve been in very deep recessions, that number’s gone as low as, I think, somewhere eight to 12 times earnings for the S&P. It may have even gotten lower than that before when a market traditionally is fair to a little bit more aggressively valued. You’re talking 12 to 20, 12 to 22. And we’re talking about basic stocks here. Certain industries have different PEs. Companies that grow a lot will have higher PEs. But this is all just very broad generalization. When you look at the market now and you see that the S&P, which is a collection of all different industries, is trading above 30 times earnings, to me that says that the stock market is overvalued.
MT: Severely, right?
Chris Irons: Yes. Because in essence, when you buy a stock at a multiple, what you’re doing is you’re betting if a company trades 10 times earnings and it earns $2 a share this year, it’d be trading at $20 a share, take your full year EPS, and you divide that into the share price and that’s your price-to-earnings multiple, give or take some other bullshit. That’s not really important. That number, what you’re doing is you’re buying 10 years of forward earnings under the assumption that the company is going to either be enough or last long enough that it’s going to pay you more than 10 years worth of earnings because you’re paying upfront 10 years worth of earnings. The market’s a forward looking indicator.
So when you’re buying the S&P today, you’re buying 35 years of what the S&P is set to earn this year or next year. Now, because of inflation and because of earnings growth, that number usually does move higher. But if you get into a situation where, and that’s in general X-ing out individual company performance, but if you get into a situation where earnings start to stagnate or decline, that 35 multiple can become a 40 multiple or can become a 45 multiple, and you don’t have a lot of leeway there. Now you’ve paid for 45 years worth of earnings that at least now in the short to midterm may not be coming to fruition. You may have to wait significantly longer than you thought. So that’s why you always hear companies talk about price-to-earnings multiples. Tesla’s a stock that everybody talks about, right?
The debate on Tesla, which trades right now at something over a hundred times earnings, which is extreme, that’s very aggressive even for a technology company. Microsoft, Apple, Nvidia, they’re between 30 and 45 times earnings because they’re expected to grow significantly. They’re branching out into other businesses. Tesla is trading at over a hundred times earnings. And the debate is whether or not the new shit that they’re going to bring to market, things that they claim that they’re working on, Robotaxis and the Optimist Robot and the AI and whatever other shit they say they’re working on, whether that is going to fill in the gap of these significantly aggressive expectations that the market is pricing into the stock now, because traditional automakers, people that are skeptics, say if you look at Ford, if you look at General Motors, if you look at Volkswagen, if you look at Stellantis and you go overseas, look at Renault, these companies are trading between five and 15 times earnings.
So somebody’s wrong: either the people that think it’s a car company are wrong because they have this aggressive new technology that’s going to earn them so much more money in the future. Or the people that are paying a hundred times earnings now are wrong because at its core, it’s really a car company and it’s aggressively overvalued. And so the question is, especially with all the volatility from Tesla, whether their legacy auto business, which generates their revenue and cash flow, will begin to decline. If that happens, that 100 becomes 150 times earnings very quickly. And so that’s a good example of how you could see people arguing over multiples, because I’ve seen people this week say, oh, it came from 400 to 200, so it’s cheap.
Well, if you believe it should be valued like a traditional automaker, it isn’t cheap. It’s 10 times more expensive than it should be. But if you believe it’s going to be the first company of its kind to have taxis all over the nation and it’s barely tapping into a hundred trillion dollars industry, well then it’s incredibly undervalued. So the multiple tells you how aggressive the market is being on a particular company or on the stock based on their forward-looking expectations.
MT: So everybody’s being too bullish.
[Eds note: this interview was conducted before the recent price drops]
Chris Irons: If you ask my opinion, I would say that’s a gross understatement. I would say that we are in a period of insane euphoria driven by a significant amount of liquidity that was put into the market during Covid. I mean, the speculation that’s out there is not like anything I’ve ever seen. You have entire industries, something like Fartcoin had billions in market cap at one time. What does that mean? That means there’s billions floating around out there in this asset that for all intents and purposes, everybody knows is a joke. It’s worth nothing. It serves no purpose. It’s not a product, it’s not a service. That’s how aggressive people are being. So in a recessionary environment or an environment where the market starts to cascade lower, all of that, what they call malinvestment dog shit, all of that has to come in. All of that money has to evaporate. All of that speculation has to evaporate.
So if you look historically where the market’s multiple is now, if you look at the Schiller PE, which is just a way to adjust the PE for growth, look at something like the Schiller PE of the overall market. There’s only been one time in history where it’s as high as it is now. And that was right before the 2000 bubble. So that’s the level of aggressive valuation we’re at right now. We’re at about year 2000 bubble aggressiveness.
MT: Back in a new paradigm.
Chris Irons: Exactly. This time it’s different.
MT: Thanks, Chris.
Chris Irons: Thank you.