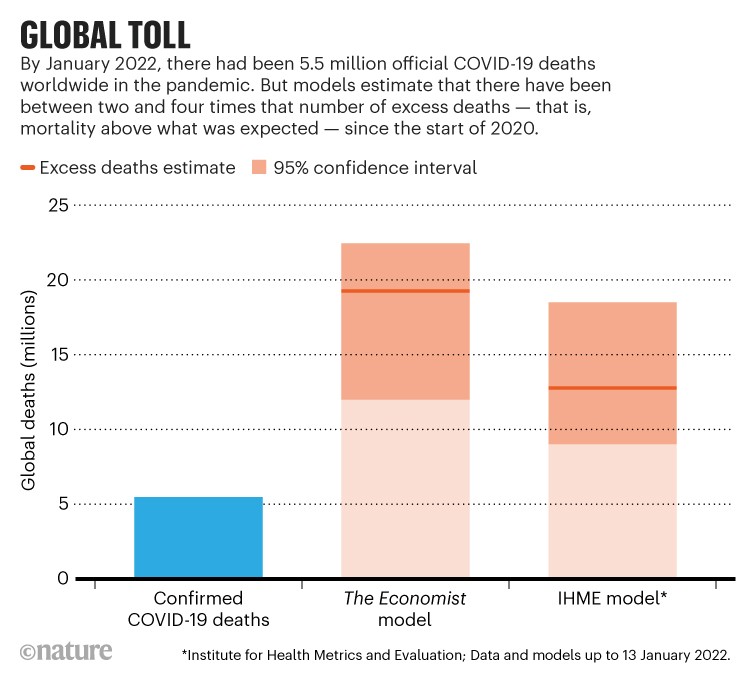
Last year’s Day of the Dead marked a grim milestone. On 1 November, the global death toll from the COVID-19 pandemic passed 5 million, official data suggested. It has now reached 5.5 million. But that figure is a significant underestimate. Records of excess mortality — a metric that involves comparing all deaths recorded with those expected to occur — show many more people than this have died in the pandemic.
Working out how many more is a complex research challenge. It is not as simple as just counting up each country’s excess mortality figures. Some official data in this regard are flawed, scientists have found. And more than 100 countries do not collect reliable statistics on expected or actual deaths at all, or do not release them in a timely manner.
Demographers, data scientists and public-health experts are striving to narrow the uncertainties for a global estimate of pandemic deaths. These efforts, from both academics and journalists, use methods ranging from satellite images of cemeteries to door-to-door surveys and machine-learning computer models that try to extrapolate global estimates from available data.
Among these models, the World Health Organization (WHO) is still working on its first global estimate, but the Institute for Health Metrics and Evaluation in Seattle, Washington, offers daily updates of its own modelled results, as well as projections of how quickly the global toll might rise. And one of the highest-profile attempts to model a global estimate has come from the news media. The Economist magazine in London has used a machine-learning approach to produce an estimate of 12 million to 22 million excess deaths — or between 2 and 4 times the pandemic’s official toll so far (see go.nature.com/3qjtyge and ‘Global toll’).
Sources: Our World in Data/The Economist/IHME
The uncertainty in this estimate is a discrepancy the size the population of Sweden. “The only fair thing to present at this point is a very wide range,” says Sondre Ulvund Solstad, a data scientist who leads The Economist’s modelling work. “But as more data come in, we are able to narrow it.”
The scramble to calculate a global death toll while the pandemic continues is an exercise that combines sophisticated statistical modelling with rapid-fire data gathering. Everyone involved knows any answer they provide will be provisional and imprecise. But they feel it is important to try. They want to acknowledge the true size and cost of the human tragedy of COVID-19 (see ‘Comparing pandemics’), and they hope to counter misleading claims prompted by official figures, such as China’s count of just under 5,000 COVID-19 deaths or Russia’s of just over 300,000.
COMPARING PANDEMICS
According to some estimates of excess deaths, the COVID-19 pandemic is the largest since the 1918–20 H1N1 influenza pandemic when scaled to 2020 populations.
Metric | COVID-19 | Flu 2009 (H1N1) | Flu 1968 (H3N2) | Flu 1957–59 (H2N2) | Flu 1918–20 (H1N1) |
|---|---|---|---|---|---|
Per-capita excess mortality rate (estimate) | 0.15–0.28% | 0.005% | 0.03% | 0.04% | 1% |
Global excess deaths (estimate) adjusted to 2020 population | 12 million–22 million | 0.4 million | 2.2 million | 3.1 million | 75 million |
Mean age at death (years; United States and Europe only) | 73–79 | 37 | 62 | 65 | 27 |
Flawed figures
Death and taxes are famously the only certainties in life, but countries account for each of them in vastly different ways. Even superficially similar places can have varying approaches to recording COVID-19 deaths. Early in the pandemic, countries such as the Netherlands counted only those individuals who died in hospital after testing positive for the coronavirus SARS-CoV-2. Neighbouring Belgium included deaths in the community and everyone who died after showing symptoms of the disease, even if they weren’t diagnosed.
That is why researchers quickly turned to excess mortality as a proxy measure of the pandemic’s toll. Excess-death figures are seemingly easy to calculate: compare deaths during the pandemic with the average recorded over the previous five years or so. But even in wealthy countries with comprehensive and sophisticated systems to report deaths, excess-mortality figures can be misleading. That’s because the most obvious way to calculate them can fail to account for changes in population structure.
“We should be careful about this issue, because looking at the average raw data is really flawed,” says Giacomo De Nicola, a statistician at Ludwig Maximilian University of Munich, Germany.
When De Nicola and colleagues worked on a 2021 study to calculate excess mortality caused by the pandemic in Germany, they found that comparing deaths to average mortality in previous years consistently underestimated the number of expected deaths, and so overstated excess deaths1. The reason was a rise in annual national mortality, contributed to by a surge in the number of people aged 80 and above — a generation too young to fight and die in the Second World War.
The difference for Germany is significant. Press-released raw data from the German statistical office last year reported 5% more deaths in 2020 compared with 2019. But after taking the age structure into account, De Nicola’s group reduced this to just 1%. “Due to the lack of a generally accepted method for age-adjustment, I’m pretty certain this issue extends to many more countries,” he says.
Some demographers agree. “It concerns me that some so-called excess-deaths estimates by national statistical offices just use an average of the past five years of deaths as the expected deaths. In ageing populations, this is unlikely to be the best estimate,” says Tom Wilson, a demographer at the University of Melbourne, Australia. Responding to De Nicola’s work, Felix zur Nieden, a demographer at Germany’s statistical office, says he agrees that raw numbers should be adjusted to take age structure and other subtleties into account.
More-sophisticated analyses adjust the expected deaths baseline to account for such biases, for example by raising the number of expected deaths as a population ages. Probably the most comprehensive of these excess-mortality estimates come from Ariel Karlinsky, an economist at the Hebrew University of Jerusalem in Israel, and Dmitry Kobak, a data scientist at the University of Tübingen, Germany.
Since January 2021, Karlinsky and Kobak have produced a regularly updated database of all-cause mortality before and during the pandemic (2015–21) from as many sources and for as many places as possible2 — currently some 116 countries and territories. Called the World Mortality Dataset (WMD), the bulk of the information comes from official death statistics collected and published by national offices and governments. The duo then works with these data to estimate excess mortality, including trying to take into account death tolls associated with armed conflict, natural disasters and heatwaves. For example, they assumed that 4,000 lives were lost in both Armenia and Azerbaijan during the 2020 Nagorno-Karabakh war.
Karlinsky, who previously worked on health economics, recognized that even the best epidemiological models were based on official reported COVID-19 numbers that, for many places, were clearly too low or missing entirely. “Many people had been throwing around their conjectures about excess mortality without basing it on data,” he says.
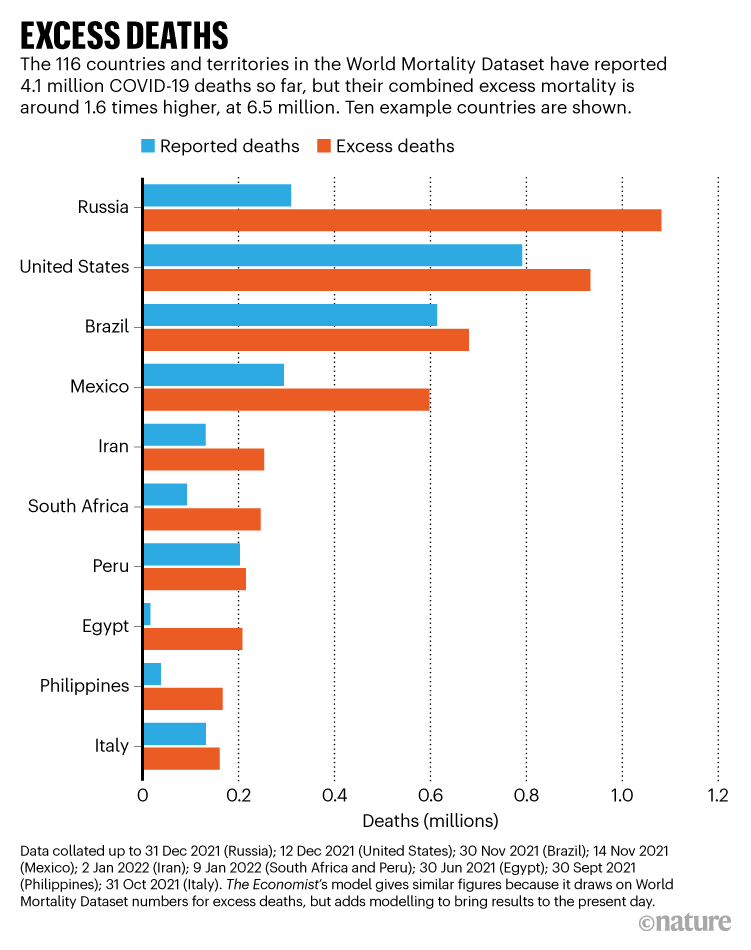
In many cases, Karlinsky and Kobak’s estimates of excess deaths diverge significantly from COVID-19 mortality statistics released by governments. Russia, for instance, reported more than 300,000 COVID-19 deaths by the end of 2021, but is likely to have exceeded 1 million excess deaths in that time (see ‘Excess deaths’).
Source: World Mortality Dataset
For countries covered by the WMD, official figures suggest that 4.1 million deaths since the start of the pandemic are down to COVID-19 — around 10% of all deaths during that time. But the duo’s calculations suggest that, when excess mortality is taken into account, deaths related to COVID-19 are 1.6 times greater, at around 6.5 million deaths (or 16% of the total). In some countries, the relative impact of the virus is even higher. One-third of all deaths in Mexico can be attributed to the virus, Karlinsky and Kobak’s data suggest.
Excess deaths include mortality that is not related to COVID-19, such as other infectious diseases, as well as indirectly related deaths, such as a person with cancer who died because their screening was cancelled owing to the pandemic’s impact on health-care systems. Some countries, such as New Zealand, even had negative excess mortality, because they experienced few losses to COVID-19 and saw a drop in deaths from influenza. But Karlinsky argues that, overall, data show that estimating excess deaths is a reliable way to measure COVID-19 casualties.
Modelling global deaths
The WMD lacks excess-death estimates for more than 100 countries, including China, India and many in Africa. That’s because those countries either do not collect death statistics or do not publish them speedily. But they also account for millions of COVID-19 deaths. A true pandemic global death toll cannot be counted without those data, but some researchers argue it is possible to model one.
Such an estimate has been produced for a pandemic before — for influenza. Starting in the Americas in March 2009, a type of H1N1 influenza A virus ravaged the world for more than a year. By the time the WHO declared that pandemic over in August 2010, the organization’s ‘official’ toll, made up of laboratory-confirmed deaths, was less than 19,000.
A team of international public-health experts took a different approach. Starting with estimated influenza deaths in 20 countries, together covering more than one-third of the world’s population, the researchers looked for factors that could explain why some of these countries fared better or worse than others. They found ten indicators, including population density, number of doctors and income. The relationship between these contributing factors and deaths for a given country allowed them to model how many flu deaths they would expect in other countries, purely on the basis of a country’s performance on these indicators3.
Their study suggested that between 123,000 and 203,000 people died in the pandemic in the last 9 months of 2009 — about 10 times the WHO count. In 2019, the same team repeated the exercise to model deaths from seasonal flu epidemics from 2002 to 2011, starting this time with data from 31 countries. They reported that an average of 389,000 respiratory deaths (uncertainty range 294,000 to 518,000) were associated with flu globally for each year modelled4.
The same method should work for COVID-19, says Cécile Viboud, an epidemiologist at the National Institutes of Health in Bethesda, Maryland, who worked on the 2019 influenza study. “We have much more data [for COVID-19] than we did with flu. So, in a way it is cleaner.” Unlike with flu, it should be much easier to attribute respiratory deaths to the COVID-19 pandemic, she says, because the circulation of almost every other respiratory pathogen was stopped owing to lockdowns and other measures. “Statistically, it’s a much easier proposition,” Viboud says.
The model used by The Economist to track the COVID-19 pandemic uses machine learning to identify more than 100 national indicators that seem to correlate with excess deaths in more than 80 countries where data are available. These features include official deaths, the scale of COVID-19 testing and the results of antibody surveys, but also geographical latitude, the degree of Internet censorship and the number of years a country has been a democracy. It is possible to examine the importance of each indicator in the model, but this is far from straightforward — features can act in combination, and their relative importance might differ for countries that have different characteristics, says Solstad.
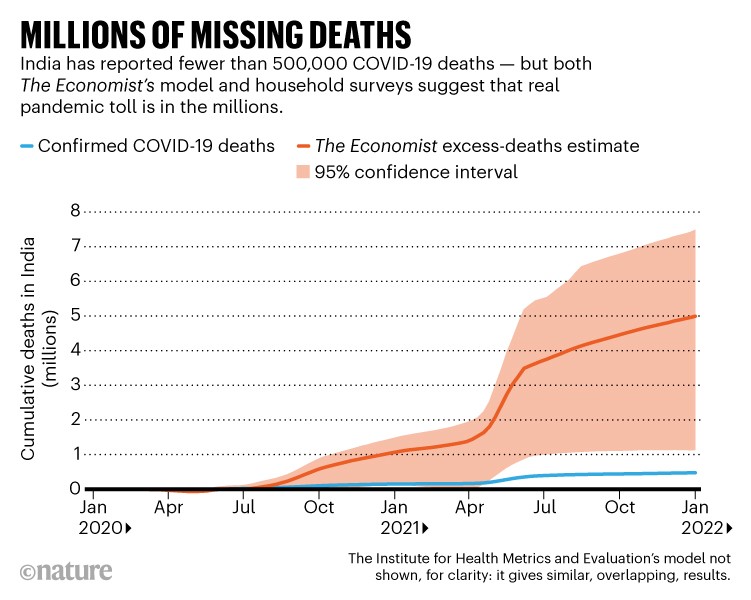
Plug numbers for these indicators for a country that doesn’t produce mortality data into the model, and algorithms estimate that country’s excess deaths. The model estimates some 5 million deaths in India, for example, 10 times higher than the country’s official COVID-19 toll of less than 500,000 deaths (see ‘Millions of missing deaths’). That estimate is sadly plausible — using sample surveys of households and sub-national mortality data, academic groups have separately estimated that as many as 3 million to 5 million people might have died from COVID-19 in India5,6. The Economist’s algorithm has a wide uncertainty interval of between 1 million and 7.5 million deaths for India.
Sources: Our World in Data/The Economist
For China, the model estimates almost 750,000 deaths (well over 150 times higher than the country’s reported 4,600), but with a wide uncertainty interval ranging from as low as 200,000 fewer deaths than expected, to as high as 1.9 million excess deaths. Some researchers think that although China’s report of only 4,600 deaths is probably an underestimate, The Economist’s central estimate overstates the real number. COVID-19 deaths could well have been under-reported there in the first few frantic months of the pandemic, Karlinsky and other researchers say, but probably only by a factor of two or three. Since then, China’s strict zero-COVID policy has probably stemmed the number of deaths.
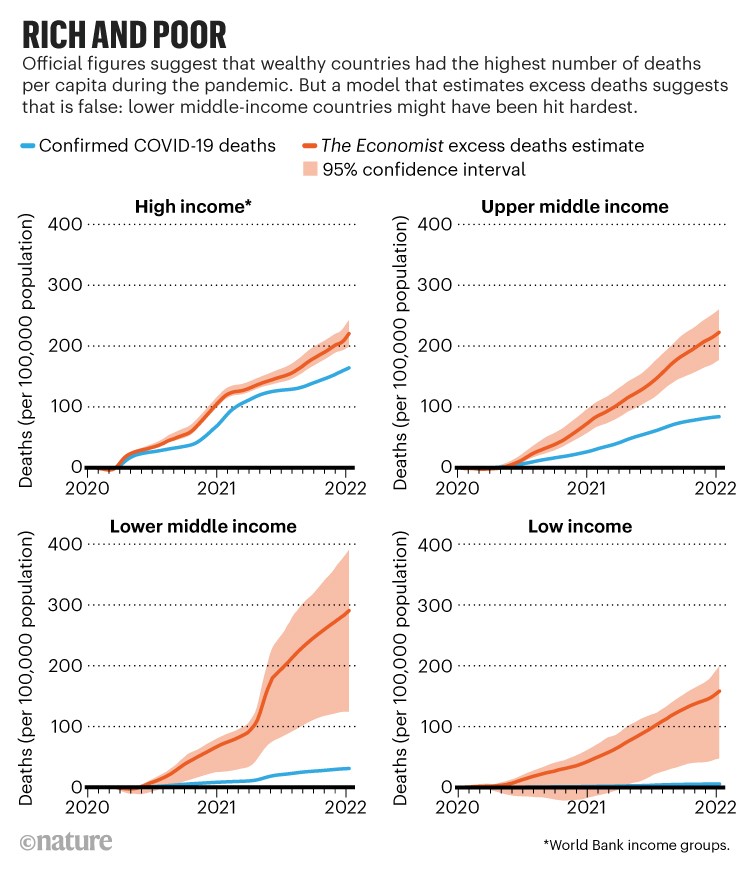
The Economist’s model highlights how countries’ official death counts often underestimate the true number — but that the extent of the underestimate varies. Excess deaths in the world’s richest countries might be around one-third above official counts, but those in the poorest countries could be more than 20 times higher, although these estimates are extremely uncertain.
Overall, the model suggests that lower middle-income countries (as described by World Bank groupings) have suffered at least as severely in per-capita deaths as rich countries — in contrast to the picture given by official figures (see ‘Rich and poor’). That’s despite the fact that these poorer countries have younger populations, adds Solstad.
Source: The Economist
Bad practice?
Not everyone agrees with the approach. One vocal critic of the magazine’s pandemic modelling is Gordon Shotwell, a data scientist in Halifax, Nova Scotia, who published a blog post that called it irresponsible (see go.nature.com/3jpdkrs). “Models like this have the effect of putting a thin veneer of objectivity and science-y thinking over what’s basically an op-ed,” he wrote.
In September, for instance, the magazine used its model results to say that pandemic deaths in Kenya were between 19,000 and 110,000, versus an official figure of 4,746.
“Using any model to make an estimate about those places I think is just bad practice,” Shotwell told Nature. “You don’t learn anything by training a model on mostly rich countries with high life expectancy and applying it to poor countries with low life expectancy.”
Solstad, not surprisingly, sees it differently: “I think it is better to provide an uncertain number than to rely on a very certain number that is clearly false.”
Very low or zero ‘official’ numbers of COVID-19 deaths for countries where data are patchy or lacking present problems of their own, he says. They have fuelled nonsense theories that people in Africa have genetic resistance to the disease and don’t need international help or vaccines, for instance.
Some demographers see Shotwell’s point of view, saying that applying modelling to countries without their own deaths data is inherently difficult. “The process is intrinsically flawed. The data are a real mess and so any modelling effort is going to be very speculative,” says Jon Wakefield, a statistician at the University of Washington in Seattle, who leads a modelling project run by the WHO to estimate the pandemic’s excess death toll. “It’s very frustrating as the data are so limited. I’m not happy with the assumptions we’re being forced to make, but we’re doing the best we can.”
The project, which uses a more straightforward statistical model than The Economist to fill in the gaps, was scheduled to publish its first results in December, but they had not been released by mid-January as Nature went to press.
Separate estimates of real-time global deaths from the pandemic are also produced by the Institute for Health Metrics and Evaluation (IHME), an independent global health-research centre at the University of Washington. The IHME’s modelling says between 9 million and 18 million people have died so far; it also tries to forecast how this number will grow, and how fast.
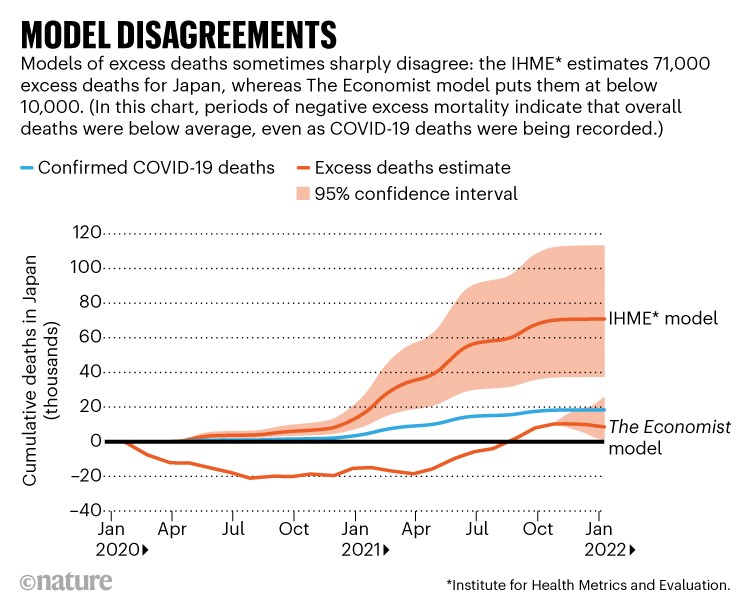
Although its overall global mortality figure agrees with other estimates, there are significant differences at the national level. For example, the IHME puts cumulative excess deaths at almost 71,000 for Japan, compared with the official 18,000 reported. Yet The Economist’s model estimates Japan’s excess deaths at between 550 and 27,000 (see ‘Model disagreements’).
Sources: Our World in Data/The Economist/IHME
There are other discrepancies, too. In contrast to The Economist’s estimate, the IHME estimates just 8,500 excess deaths in China (with a range of 5,400–17,000). Meanwhile, in May, the IHME made headlines and drew criticism for suggesting that US excess deaths in the pandemic up to that time were as high as 900,000 people. That was some 300,000 greater than other estimates, such as from the US Centers for Disease Control and Prevention and the WMD. In October, the IHME quietly reduced the May figure to 670,000 after making changes to its modelling strategy, which some in the field complain is opaque and hard to follow.
The IHME says it will soon publish a paper detailing its model. It also says its initial US excess-death estimate was too high because it had not taken into account that winter deaths from influenza and respiratory syncytial virus might fall, and that it could include this information only once official data came in months later.
Better estimates
Even the best models are only as good as the data they rest on. Through the WHO project, demographers and others are searching for ways to improve counts and estimates of death tolls in countries that don’t have reliable national mortality data. Researchers have shown this can be estimated, for example, by extrapolating from smaller regions in a country, where limited data might be available.
In a study7 that has not yet been peer reviewed, Karlinsky used deaths reported in a regional newspaper for the Argentinian province of Córdoba to extrapolate a nationwide excess-death estimate of 120,155 from March 2020 to August 2021, compared with official COVID-19 deaths for the period of 111,383.
Another method is to survey a representative sample of households to ask them about deaths. “This is essentially how annual number of deaths are estimated in countries without good vital registration, like Bangladesh,” Karlinsky says. Such surveys are under way in many countries and, in some cases, have already shown that excess mortality is several times higher than official COVID-19 deaths.
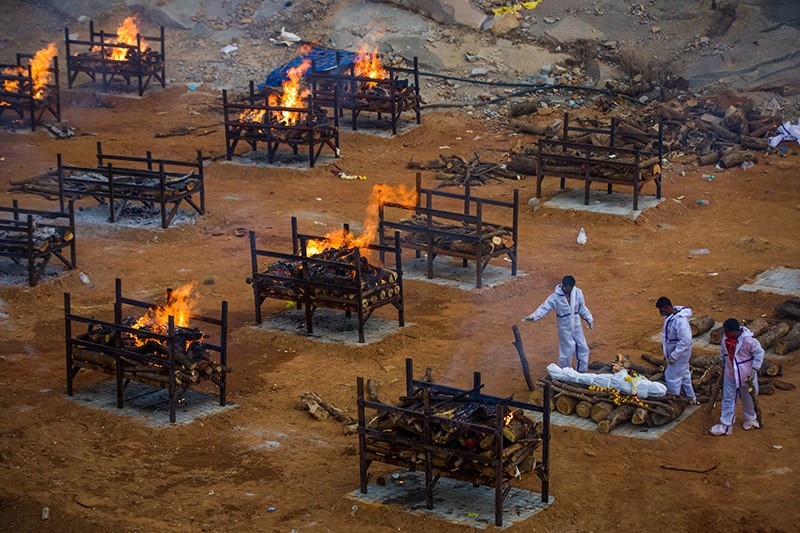
Crematorium workers in Bangalore in April 2021. COVID-19 deaths in India are estimated to be many times higher than official statistics.Credit: Abhishek Chinnappa/Getty
This month, for instance, a team led by epidemiologist Prabhat Jha at the University of Toronto in Canada reported the results of a telephone survey of adults in India conducted by a private polling agency tracking the pandemic. The team found that there were more than 3 million COVID-19 deaths in India up to July 2021, an estimate backed up by examining mortality data in health facilities and civil-registration deaths in ten states. The researchers — who note that other scientists have come to similar conclusions — estimate that, as of September 2021, India’s COVID-19 deaths were 6–7 times higher than official statistics5.
Mervat Alhaffar, a public-health researcher at the London School of Hygiene and Tropical Medicine (LSHTM), worked on a study that used an even more direct method to estimate deaths: counting graves. Using satellite images of 11 cemeteries in Aden province in Yemen, the study suggested that weekly burials increased by up to 230% between April and September 2020. It estimated that, as a result of the COVID-19 pandemic, excess deaths for the region were 2,120 during the same period8. Another LSHTM team has applied the same technique to count fresh graves in Mogadishu, Somalia, estimating9 that the city’s excess death toll between January and September 2020 was 3,200 to 11,800.

An aerial view of a cemetery in Aden, Yemen, where dozens of fresh graves appeared in May 2020 as COVID-19 spread through the region.Credit: AP/Shutterstock
Alhaffar says the technique is useful, but can’t be applied everywhere. “You need to engage with the locals on the ground, to understand the burial practices and make sense of the images,” she says. It can be hard to establish such connections, she adds, because people in conflict zones often fear the reaction of local authorities.
And, in countries where data are scarce, cultural burial practices are harder to track. “In some places, where people might prefer to bury their loved ones in smaller graveyards nearer to their houses rather than in the big ones, analysing satellite images of cemeteries can be much more challenging,” Alhaffar says.
Amid the search for ways to count deaths, Andrew Noymer, a demographer at the University of California, Irvine, says the pandemic and the increased demand for real-time mortality figures highlight a demographic shortcoming that goes back decades: many countries simply don’t collect good data on births, deaths and other vital statistics. “Demographers have been part of the problem, because we have helped to put band-aids on this for 60 years. We’ve developed all sorts of techniques to estimate demographic rates in the absence of hard data,” he says.
That means the true death toll of COVID-19 might always be disputed. “We still don’t know how many people died in the 1918 [flu] pandemic, but I always figured we would know pretty well how many people would die in the next one, because we live in the modern world,” Noymer says. “But we don’t actually, and that’s kind of sad for me as a demographer.”
Nature 601, 312-315 (2022)
doi: https://doi.org/10.1038/d41586-022-00104-8
No comments:
Post a Comment
Note: Only a member of this blog may post a comment.