Here a few measures of inflation:
The first graph is the one Fed Chair Powell has been mentioning. Click on graph for larger image.
This graph shows the YoY price change for Services and Services less rent of shelter through March 2023.
Services were up 7.2% YoY as of March 2023, down from 7.6% YoY in February.
Services less rent of shelter was up 6.1% YoY in March, down from 6.9% YoY in February.
Services less rent of shelter was up 6.1% YoY in March, down from 6.9% YoY in February.
Will services ex-shelter inflation be persistent, or will it follow a similar pattern as goods? This is a topic I discussed last month in Pandemic Economics, Housing and Monetary Policy: Part 2.
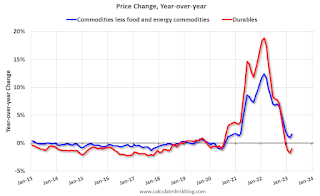 The second graph shows that goods prices started to increase year-over-year (YoY) in 2020 and accelerated in 2021 due to both strong demand and supply chain disruptions.
 The second graph shows that goods prices started to increase year-over-year (YoY) in 2020 and accelerated in 2021 due to both strong demand and supply chain disruptions.
Durables were at -1.0% YoY as of March 2023, up from -1.8% YoY in February.
Commodities less food and energy commodities were up 1.6% YoY in March, up from 1.0% YoY in February.
Commodities less food and energy commodities were up 1.6% YoY in March, up from 1.0% YoY in February.
Goods inflation was transitory.
 Here is a graph of the year-over-year change in shelter from the CPI report (through March) and housing from the PCE report (through February 2023)
Shelter was up 8.2% year-over-year in March, up from 8.1% in February. Housing (PCE) was up 8.2% YoY in February.
The BLS noted this morning: "The index for shelter was by far the largest contributor to the monthly all items increase."
 Here is a graph of the year-over-year change in shelter from the CPI report (through March) and housing from the PCE report (through February 2023)
Shelter was up 8.2% year-over-year in March, up from 8.1% in February. Housing (PCE) was up 8.2% YoY in February.
The BLS noted this morning: "The index for shelter was by far the largest contributor to the monthly all items increase."

No comments:
Post a Comment
Note: Only a member of this blog may post a comment.