FEDS Notes
October 06, 2025
The State of AI Competition in Advanced Economies
Alex Haag
Global competition in artificial intelligence (AI) has intensified in recent years. Some assessments emphasize US exceptionalism, while others argue that China is eroding US dominance. By contrast, the progress of other advanced foreign economies (AFEs) receives far less attention. Existing cross-country comparisons rely largely on composite indices that, while useful as benchmarks, are subject to weighting and aggregation biases that may obscure important dimensions of AI capacity. A clearer understanding of cross-country AI capabilities can help better contextualize global AI competition.
This note brings together international comparisons on key metrics to assess countries' relative preparedness and performance in AI. The analysis shows that the United States retains important advantages in infrastructure (with the exception of electricity-related infrastructure), compute capacity, and investment conditions. AFEs face greater challenges in scaling compute resources and attracting investment. China has achieved rapid gains in research output and adoption, though its position in enabling infrastructure is less clear.1 Taken together, these comparisons suggest a global landscape in which, despite increased competition in research and applied domains, US strengths in core AI enablers remain durable.
1. Cross-Country Comparisons Using AI Indices
We start with several widely cited indices of AI capacity and preparedness to provide an initial view of the global landscape (Table 1).2 The United States consistently ranks at or near the top, with the United Kingdom close behind and Italy lowest among G7 members. China's ranking varies from just below the United States on some indices (e.g., GII, Stanford) to significantly lower than most AFEs on others (e.g., IMF, Oxford).
These indices are a useful starting point but have limitations. Methodological approaches, such as indicator selection, weighting, and aggregation, can potentially obscure core metrics of AI performance and penalize diverse national AI strategies (Greco et al., 2018). Still, these indices highlight key areas for comparison: physical and digital infrastructure, investment and firm dynamics, and adoption across the economy. The rest of this note delves deeper into these dimensions, focusing on key metrics to provide a clearer picture of global AI capabilities.
Table 1: Cross-Country Comparison in Selected Technology and Artificial Intelligence Indices
| WIPO GII | IMF AI Preparedness Index | Stanford Global AI Vibrancy Tool | Oxford Insights GAIRI | |||||
|---|---|---|---|---|---|---|---|---|
| Country | Score | Rank | Score | Rank | Score | Rank | Score | Rank |
| United States | 62.4 | 3 | 0.77 | 3 | 70.06 | 1 | 87.03 | 1 |
| Canada | 52.9 | 14 | 0.71 | 18 | 15.71 | 14 | 78.18 | 6 |
| France | 55.4 | 12 | 0.7 | 22 | 22.54 | 6 | 79.36 | 4 |
| Germany | 58.1 | 9 | 0.75 | 9 | 18.49 | 8 | 76.9 | 8 |
| Italy | 45.3 | 26 | 0.62 | 36 | 14.11 | 22 | 71.22 | 25 |
| Japan | 54.1 | 13 | 0.73 | 12 | 18.47 | 9 | 75.75 | 12 |
| United Kingdom | 61 | 5 | 0.73 | 13 | 27.21 | 3 | 78.88 | 5 |
| China | 56.3 | 11 | 0.64 | 30 | 40.17 | 2 | 72.01 | 23 |
| India | 38.3 | 39 | 0.49 | 71 | 25.54 | 4 | 62.81 | 46 |
Note: WIPO GII is the Global Innovation Index published by the World Intellectual Property Organization. GAIRI refers to the Government Artificial Intelligence Readiness Index. Index data are 2025 for Stanford Vibrancy Tool, 2024 for Oxford GAIRI and WIPO GII, and 2023 for IMF Preparedness Index. The number of countries evaluated in each index are as follows: WIPO GII (133), IMF AI Preparedness Index (174), Stanford Global AI Vibrancy Tool (36), and Oxford Insights GAIRI (188).
Sources: World Intellectual Property Organization (WIPO), IMF, Stanford University, Oxford Insights.
2. Physical and Digital Infrastructure
Physical and digital infrastructure form the foundation for AI adoption. Physical infrastructure includes data centers and high-performance computing hardware, supported by reliable energy, telecommunications, and manufacturing capabilities. Digital infrastructure adds cloud computing, data access, and other tools for widespread model deployment.
As shown in Figure 1, the United States made early, outsized investments in computing, software, and databases, with annual real investment in these areas growing over tenfold from 1995 to 2021, far outpacing AFE peers, whose growth was two- to fourfold. These early investments provided the computing power, networks, and hardware that positioned the United States to lead early in AI-related innovation and diffusion.
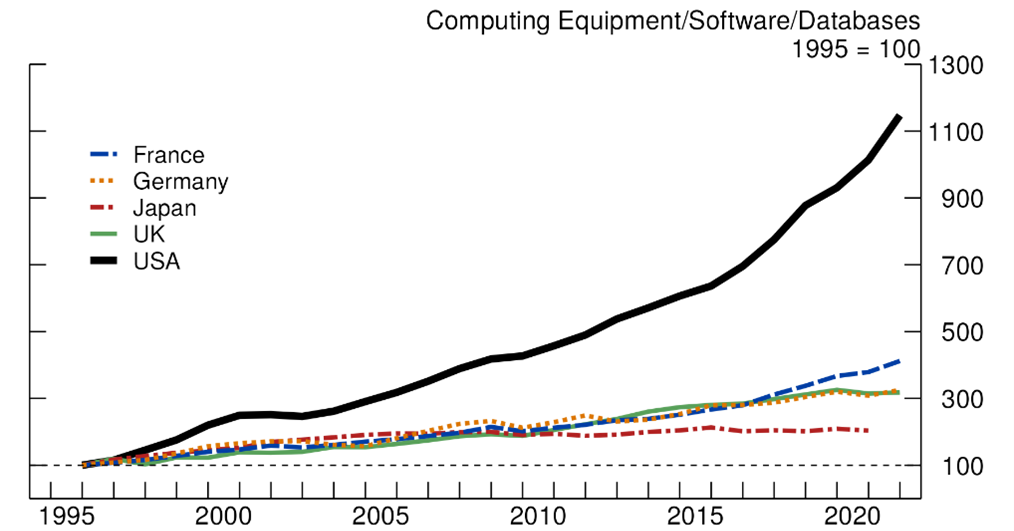
Sources: EUKLEMS, FRB Staff Calculations.
Compute, the processing power and network resources used for AI training and inference, is the clearest measure of a country's ability to develop and deploy AI. Data centers, processors (CPUs and GPUs), and broader computing systems support the growing demands of modern AI workloads.
Data center construction in the United States surged over the past decade.3 The United States hosted an estimated 4,049 data centers as of 2024, far more than the EU (~2,250), the UK (484), and China (379).4 In 2024 alone, the United States added 5.8 gigawatts (GW) of data center capacity, compared with 1.6 GW in the EU and 0.2 GW in the United Kingdom.5 On a per capita basis, the US server base stands at 99.9 per 1,000 people, far surpassing other advanced foreign economies and China (Figure 2A).
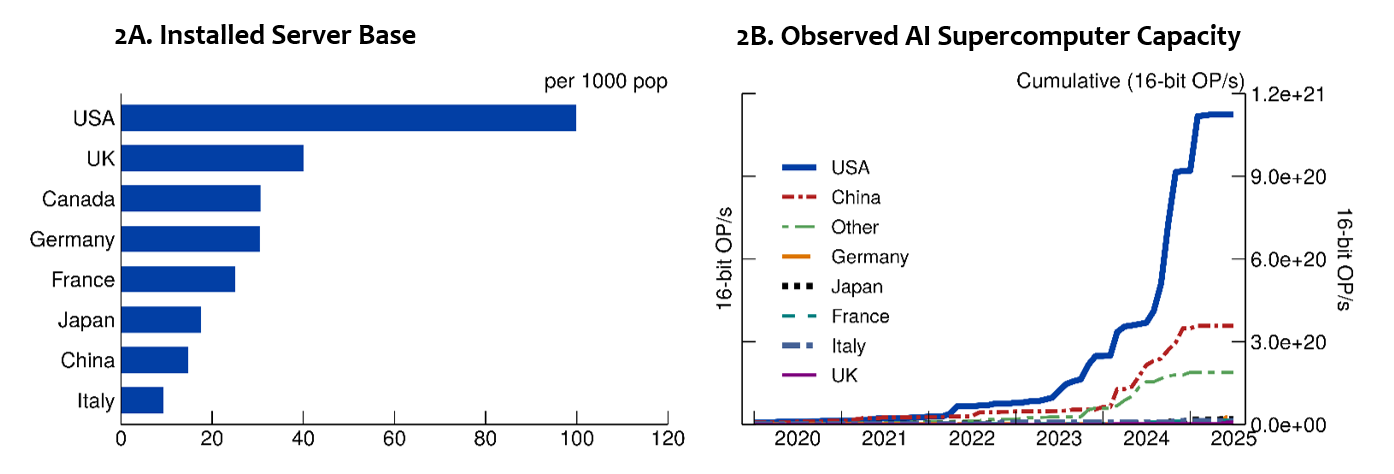
Notes: Right panel represents the sum of observed AI supercomputer capacity, covering an estimated 10–20% of the existing global aggregate. Data for Installed Server Base are 2024. Data for AI Supercomputer Capacity are through July 2025.
Sources: Tony Blair Institute for Global Change, Omdia, Epoch AI.
High-end computing, particularly AI supercomputers, is particularly critical for large-scale model training and more recently inference-based tasks. The United States dominates cumulative AI supercomputer capacity, controlling an estimated 74 percent of global high-end AI compute, while China holds 14 percent and the EU 4.8 percent (Figure 2B).
3. Energy Infrastructure Risks
The rapid growth of AI workloads is driving a substantial increase in data center power demand, highlighting the importance of electricity generation and transmission capacity in supporting AI infrastructure. RAND estimates that AI could require 117 GW globally by 2028, while the IEA projects that global electricity consumption from data centers will more than double by 2030, with the United States and China accounting for 80 percent of the growth.6
China outstripped the United States in electricity generation capacity more than a decade ago (Figure 3), with roughly 3,200 GW of installed capacity compared with 1,293 GW in the United States and 1,125 GW in the EU. China added 429 GW of net electric generation capacity in 2024 alone, over 15 times the net capacity added by the United States (Chan et al., 2025).
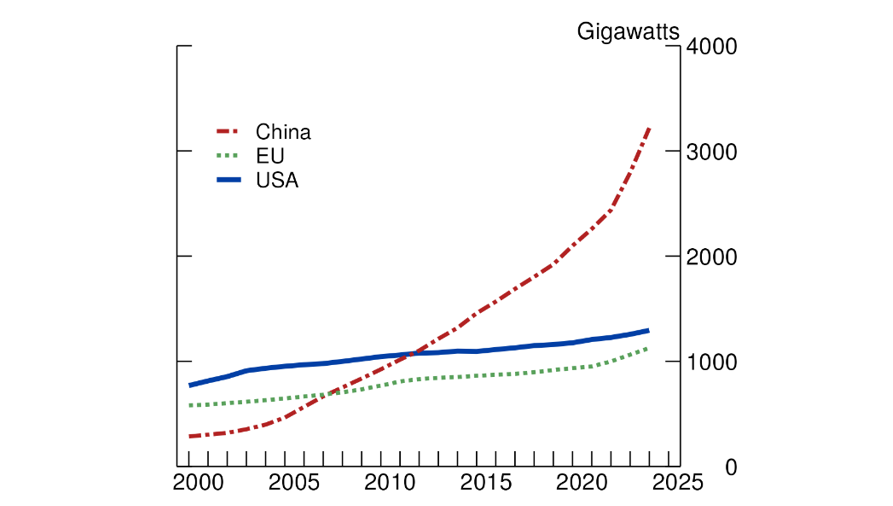
Source: International Energy Agency.
It remains unclear whether US power generation and transmission capacity will keep pace with rapidly growing data center demand. Installed data centers currently account for about 8.9 percent of average US energy use, compared with 4.8 percent in the EU and 2.3 percent in China, highlighting the scale of additional supply that may be required in the United States to support continued expansion of AI infrastructure.7
4. Private Investment and R&D
US private investment in AI far outpaces that of other advanced economies. Figure 4 shows that, from 2013 to 2024, cumulative private AI investment in the United States exceeded $470 billion, compared with roughly $50 billion across EU countries, $28 billion in the United Kingdom, $15 billion in Canada, and $6 billion in Japan.8 The gaps between the United States and other advanced economies in private investment are most pronounced in AI infrastructure, research, and data management and processing.9 The United States also accounts for the majority of global venture capital investment in AI-related data startups and over 75 percent of reported funding in generative AI ventures.10
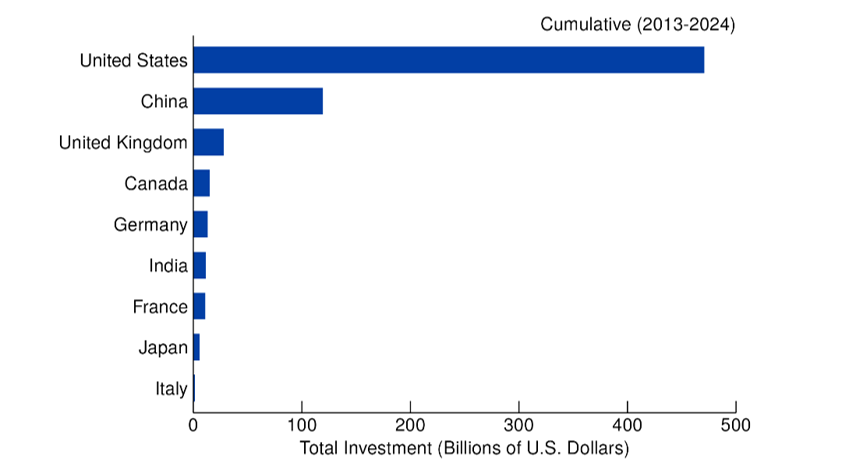
Source: Stanford 2025 AI Index Report.
Firm-level research and development in AI-adjacent sectors further underscores US AI leadership. R&D intensity, measured as R&D spending relative to sales, is highest among US firms in both ICT hardware and software sectors (Figure 5). The EU trails slightly in hardware but falls far behind in software R&D, despite strong growth over the past decade. Chinese firms scaled hardware R&D compared to a decade prior but reduced software intensity, both of which remain far behind the United States. These patterns align well with recent OECD findings showing that a larger share of US firms conduct AI-specific R&D for commercial use than their AFE peers (OECD 2025).11
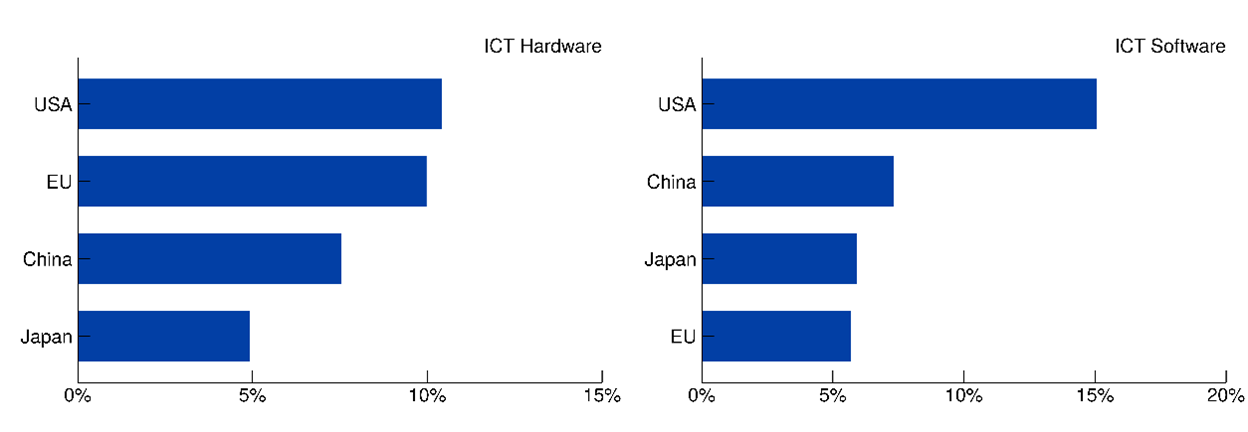
Notes: The EU R&D Investment Scoreboard covers the largest 2000 global companies in terms of research and development investment. Data are 2023.
Source: 2024 EU Industrial R&D Investment Scoreboard.
5. Domestic Adoption of AI
Comparing AI adoption across countries faces several challenges. Survey-based measures from private institutes, companies, and universities often report much higher adoption than national statistics, largely because large firms in AI-intensive sectors are overrepresented (larger firms in general have higher adoption rates across countries and surveys). It is therefore unsurprising that the United States ranks highest in surveys such as Stanford's AI Index. National statistics aim for representative samples, which include more small and medium-sized enterprises that are less likely to use AI for various reasons (see Appendix C).
Differences in definitions further complicate cross-country comparisons. For example, the US Census Bureau's biweekly BTO survey measures consistent AI use within the past two weeks, while Eurostat reports annual adoption with less specificity on intensity. As highlighted by Crane, Green, and Soto 2025, accounting for employment weighting in these surveys substantially raises estimated US adoption, suggesting that firm-level responses alone may understate the diffusion of AI.12
Table 2: Selected Survey Results on AI Adoption
| Entity | USA | Canada | France | Germany | Italy | UK | Japan | China |
|---|---|---|---|---|---|---|---|---|
| National Statistics Agencies (*) | 9.4% | 12.2% | 9.9% | 19.8% | 8.3% | 9.0% | - | - |
| University of Melbourne | KPMG International | 53.0% | 50.0% | 51.0% | 51.0% | 60.0% | 52.0% | 50.0% | 89.0% |
| Japan Communications Ministry (GAI) | 68.8% | - | - | 59.2% | - | - | 26.7% | 81.2% |
| Stanford University | McKinsey and Company | 82.0% | 80.0% | 72.0% | 75.0% | ||||
Notes: Stanford University survey only reports in regional aggregates. Adoption is defined differently across surveys and results from the table should be interpreted with caution. The Japan Communications Ministry survey focuses on generative AI use, while other surveys focus on AI more broadly.
Sources: US Census Bureau, Eurostat, Statistics Canada, UK Office of National Statistics, University of Melbourne, Japan Communications Ministry, Stanford University.
Alternative diffusion indicators, such as those focused on AI-related skills in the workplace, show the United States largely outpacing AFE peers. For example, only France surpasses the United States in fostering occupation transitions from non-AI to AI employment (a proxy for upskilling and reskilling of the workforce toward AI, Figure 6a). The United States far outpaces AFE counterparts in the incorporation of AI into production processes in manufacturing (Figure 6b), as well as in education, financial, and technology service sectors (Table A3).13 Further development and standardization of AI adoption metrics by firms and individuals will continue to clarify where advanced economies stand with regard to economy-wide AI diffusion.
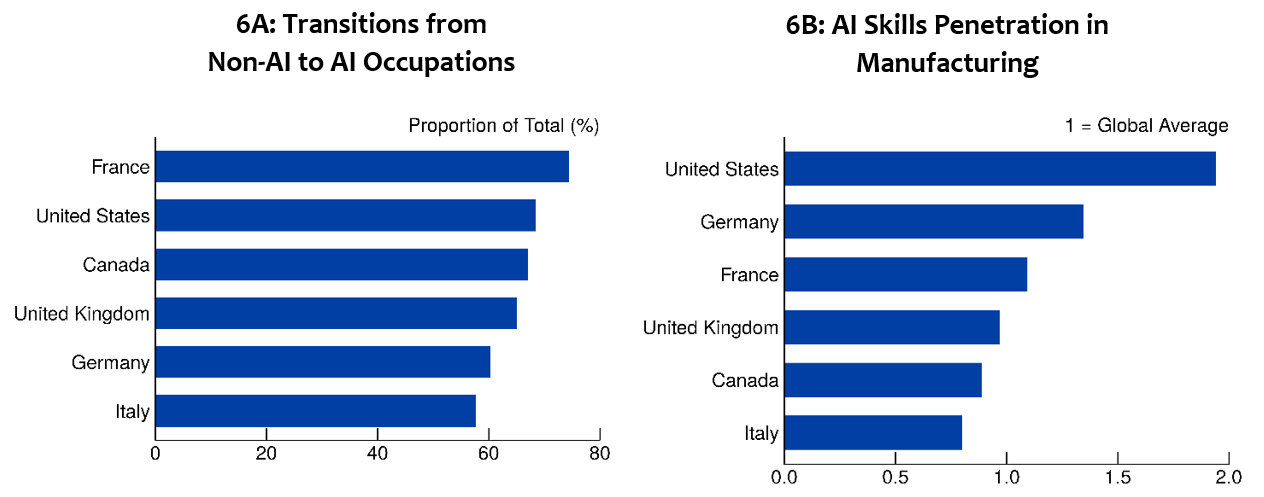
Notes: Data are the average over the 2019-2024 period. Panel 6A represents the proportion of total transitions into AI-related occupations that occur from non-AI occupations, largely reflective of upskilling or reskilling. In contrast, transitions from AI-related occupations into other AI-related occupations would be considered churn within AI occupations. Panel 6B represents self-reported use of AI skills in the manufacturing sector, where figures are scaled to the global average.
Source: OECD Artificial Intelligence Policy Observatory. Accessed September 2, 2025.
Conclusion
This note documents how the United States largely outperforms AFEs across key areas of AI capacity, while China remains remotely competitive in some areas, with its largest advantage in energy infrastructure. The combination of robust physical and computing infrastructure, sophisticated investment climate, and emphasis on diffusing AI use across the economy will likely allow the United States to capitalize on future benefits from advances in AI, while deficiencies in one or more of these areas may limit the gains from AI in AFEs over the near term.
No comments:
Post a Comment
Note: Only a member of this blog may post a comment.