Life expectancy has long symbolized human progress, but what happens when that progress slows down or even reverses? Despite decades of medical and social advances, recent data show a troubling plateau in our lifespans. To understand why, we must look beyond simple trends and explore the complex factors influencing the course of our lifespan.
Definition of life expectancy
Healthcare science often uses life expectancy as a measure of outcome. It is defined as the average number of years a person who has reached a certain age can expect to live. This is an aggregated figure that considers all factors affecting our lifespan—our genetics and biology, controllable lifestyle choices such as diet, exercise, smoking, and drinking, access to healthcare, and socioeconomic factors like income, housing, and neighborhood safety.
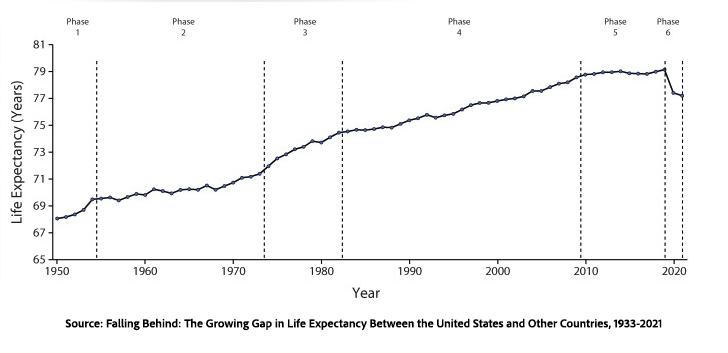
Despite increased longevity since the 1950s and the Boomers, the growth rate has plateaued and, with the pandemic considered, has actually decreased. A new study in PNAS aims to examine some of the key trends behind the stagnation in lifespan improvements. They offer a visual explanation using Lexis diagrams.
To understand what the study reveals, it helps to first see how that diagram works.
How Lexis Diagrams Work
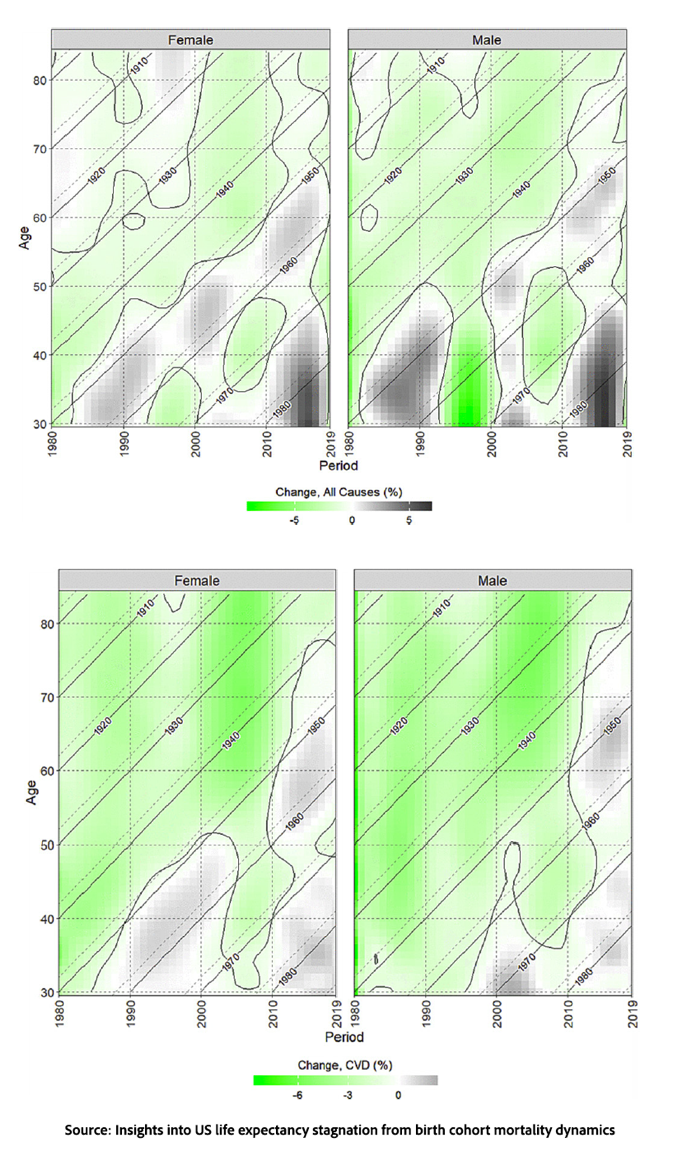
A Lexis diagram combines three dimensions of information into one image. On these charts, the x-axis represents calendar time, and the y-axis shows age. Color indicates whether mortality is improving or worsening, with darker or more intense shades showing stronger changes. This makes the diagram helpful for identifying patterns that might be missed in a typical line graph.
Read horizontally, the diagram illustrates how mortality rates change over time for people of the same age—such as comparing four-year-olds in the 1940s with four-year-olds today. Read vertically, it emphasizes the impact of events that affect multiple age groups simultaneously, like pandemics, recessions, or major medical advances. Read diagonally, it follows birth cohorts over time, showing whether one generation is faring better or worse than the previous ones.
With that framework in place, the study’s findings become easier to interpret.
The Study
Researchers examined death certificate data for individuals born from the 1890s to the 1980s, creating Lexis diagrams for all-cause mortality and the three main causes of death: cardiovascular disease, cancer, and external causes—causes originating outside the body, such as accidents, violence, etc.—which is categorized as the “other” group.
 The slowdown cannot be explained by just one cause. The study found that the stagnation results from a mix of generational (“cohort”) effects and broader societal (“period”) effects impacting multiple causes of death at the same time.
- For Baby Boomers, especially those born in the 1950s, the study suggests a transition point: at many adult ages, mortality rates were higher than in earlier generations. A major part of that shift was the slower improvement in deaths from cardiovascular disease. These patterns may also overlap with what economists have called “deaths of despair,” a term used to describe rising mortality linked to suicide, alcohol, and drugs in some middle-aged Americans, though that broader interpretation goes beyond this study alone.
- Gen Xers—people born in the 1970s—are experiencing rising mortality rates in early and middle adulthood, with earlier increases seen in cardiovascular deaths. Although deaths from smoking-related cancers have declined, colon cancers associated with obesity have increased. Of course, this generation has also been heavily impacted by waves of drug overdoses, which have raised mortality from external causes.
- A widespread rise in mortality started around 2010, impacting almost all generations alive then, indicating that broad societal or health-system factors are involved rather than just generational differences.
Those patterns describe what happened; the harder question is why those gains began to fade.
Why Have the Gains Stalled?
So why has life expectancy stalled? The short answer is a combination of various biological, behavioral, and social factors – there is no smoking gun to focus on.
Biologically, despite the dreams of tech bros, we may be approaching our biological limits. Medical advances produce survivors who are frail, and their deaths slow perceived progress. The notable stagnation in cardiovascular disease indicates both the reason for and the futility of continually lowering cholesterol levels that require treatment.
There are period-specific factors; epidemics of smoking, AIDS/HIV, opioids, and COVID all have effects that echo over time. We also cannot ignore our lifestyle choices, such as the impact of smoking on earlier cohorts and drugs on later ones, along with the rising tide of obesity and underlying metabolic disease. And there are those problematic socioeconomic factors that influence our ability to access care and avoid risk.
What emerges is not just a single failure but a layered story. Generations bear the imprint of their exposures—smoking, drugs, diet—while societies add on economic inequality, public health crises, and shifting medical advancements. Medicine continues to extend life, but it also alters who survives and with what burdens. The result is a population whose health trajectory reflects decades of accumulated choices and circumstances. Life expectancy stalls not because progress stopped, but because the forces shaping health have become more complex, interacting, and harder to influence in a single direction.
Source: Insights into US life expectancy stagnation from birth cohort mortality dynamics PNAS DOI: 10.1073/pnas.2519356123
Dr. Charles Dinerstein, M.D., MBA, FACS is Director of Medicine at the American Council on Science and Health. He has over 25 years of experience as a vascular surgeon.
https://www.acsh.org/news/2026/04/03/arc-lifespan-limits-longevity-50037
No comments:
Post a Comment
Note: Only a member of this blog may post a comment.