Illegal immigrant population has fallen 2.3 million under Trump
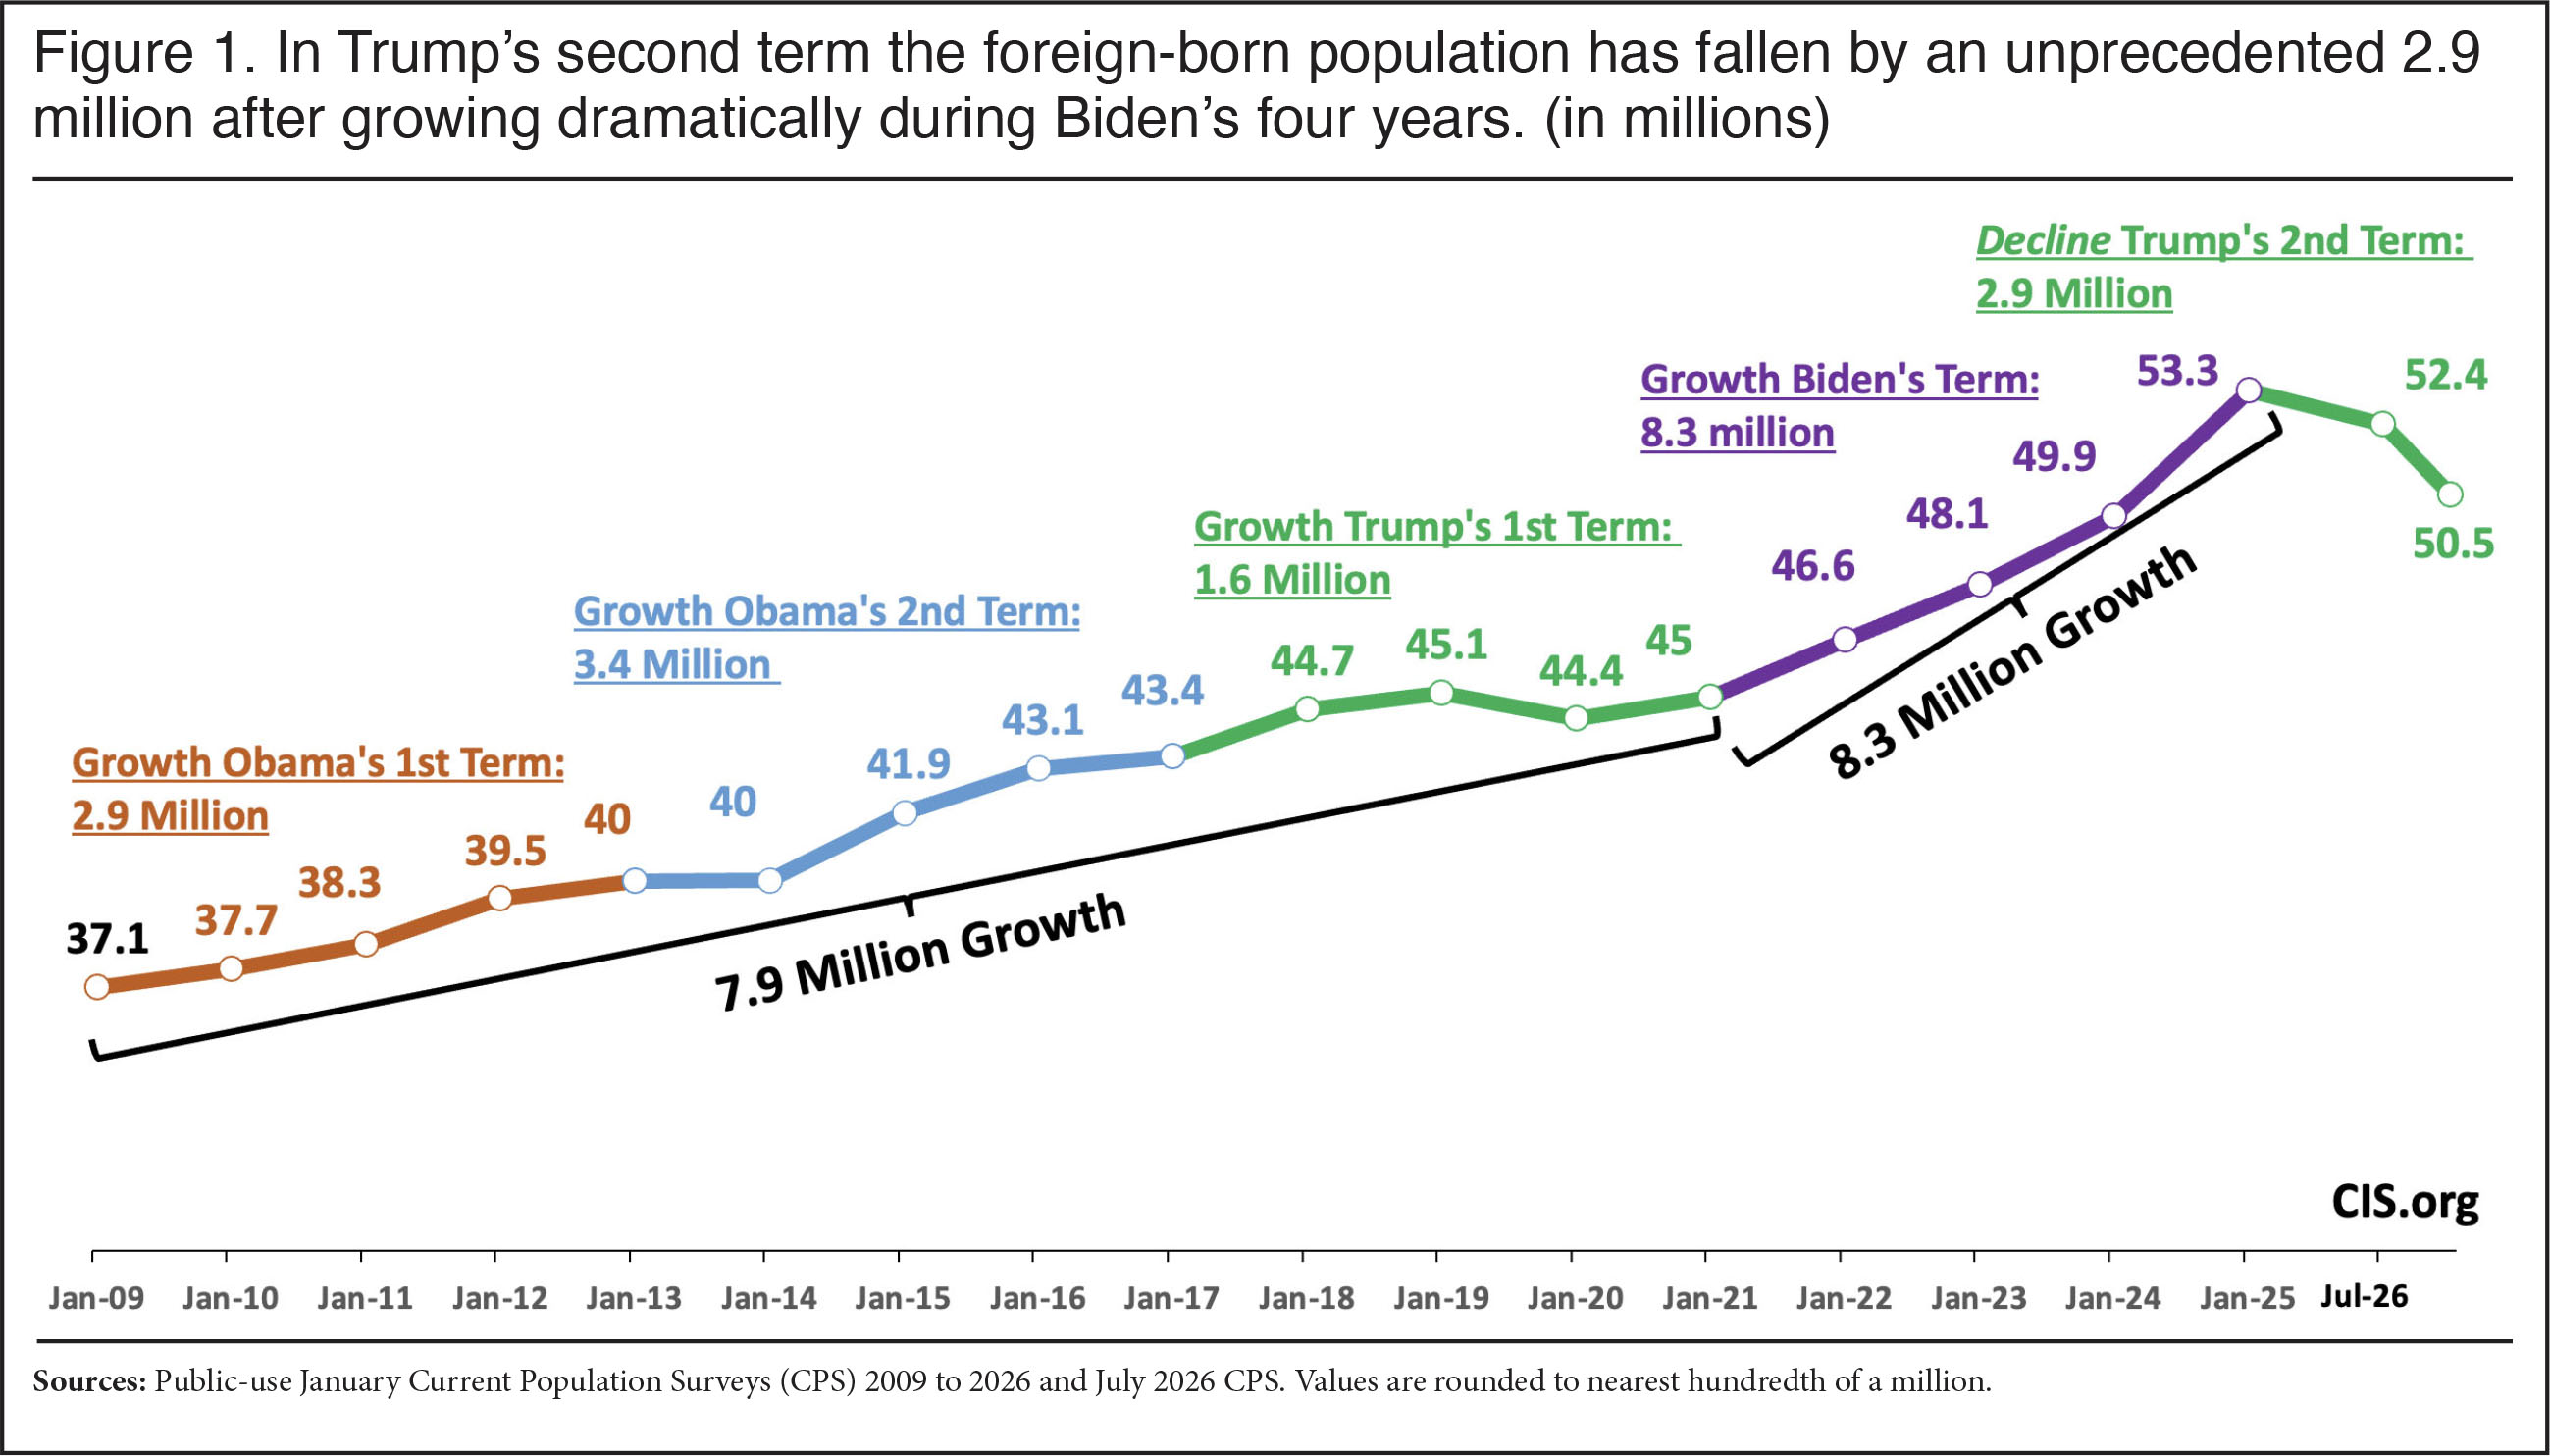
Since January 2025 when President Trump took office the government’s monthly household survey, officially called the Current Population Survey (CPS), shows an unprecedented 2.9 million decline in the foreign-born population — naturalized citizens, lawful permanent residents, long-term temporary visitors, and illegal immigrants. We preliminarily estimate that the illegal immigrant population has fallen 2.3 million. While the survey is the most up-to-date and best data available through 2026, the findings come with caveats.
Key findings:
- The total foreign-born population declined 2.9 million from January 2025 to July 2026. This follows an 8.3 million increase in the prior four years during the post-Covid border surge.
- The huge recent decline in the foreign-born population indicates that net migration to the United States was negative in the last year and a half for the first time since the 1930s.
- Latin American non-citizens who arrived in 1980 or later account for all of the decrease. This population overlaps significantly with illegal immigrants.
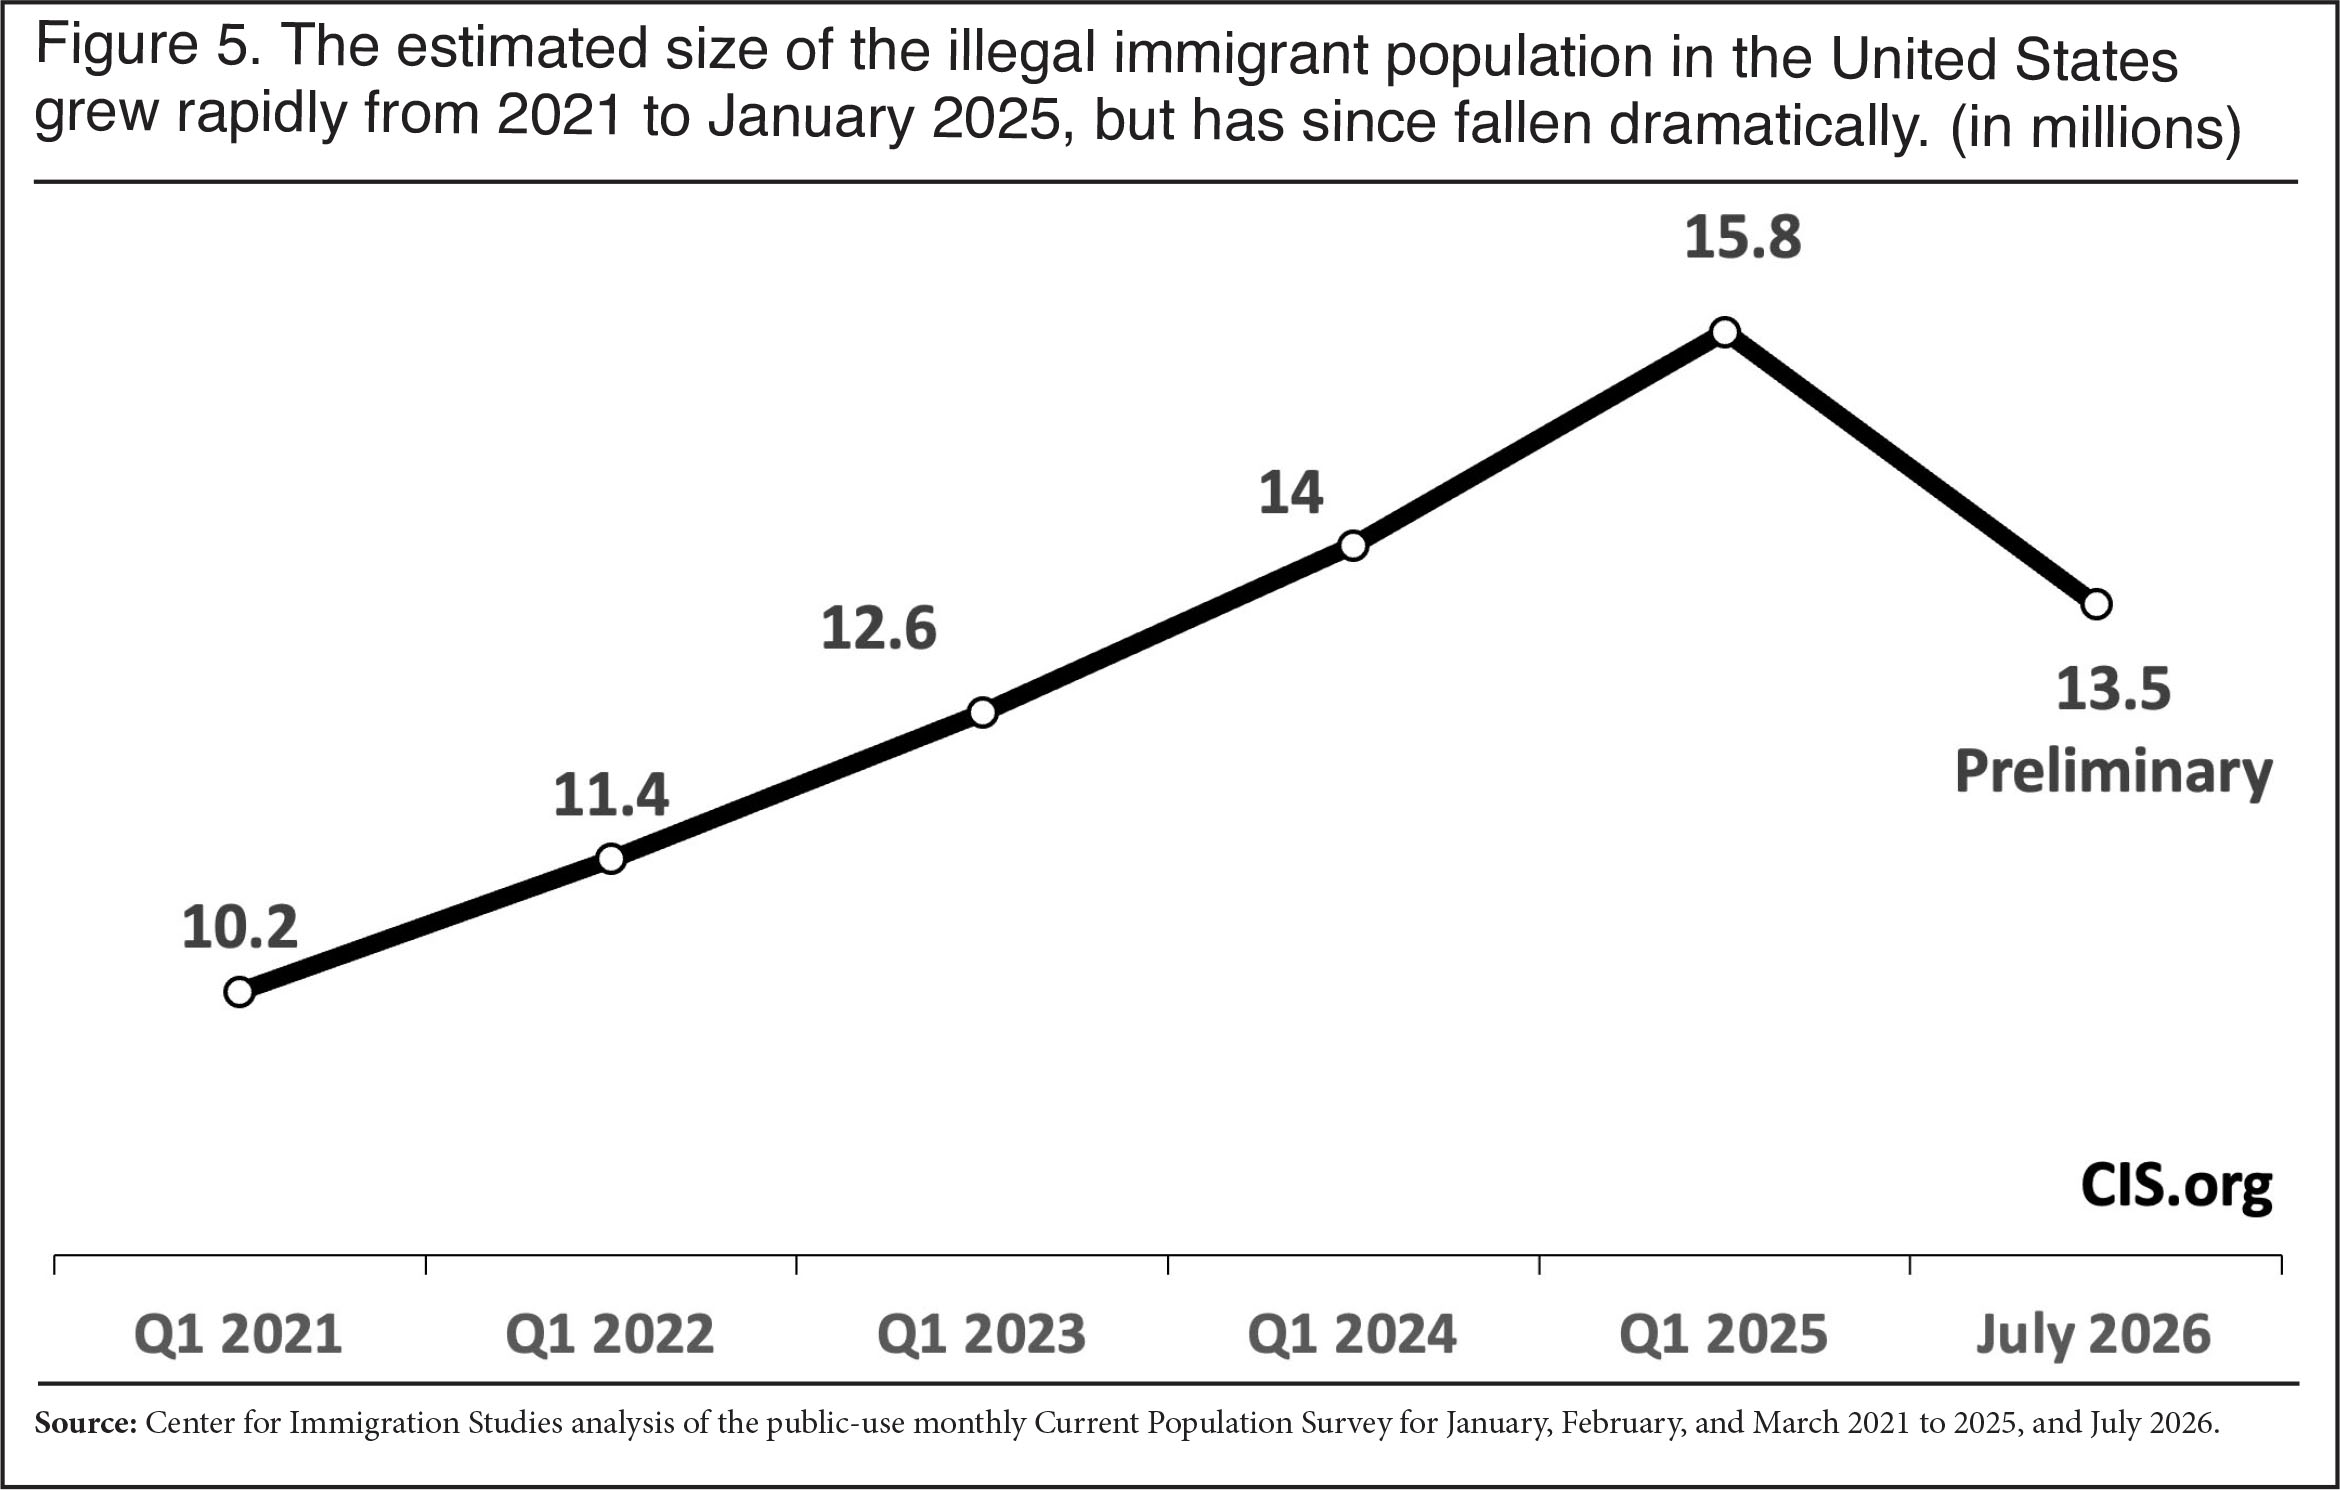
- We preliminarily estimate that the illegal immigrant population may have declined 2.3 million, from 15.8 million in January of 2025 to 13.5 million in July of 2026. The net change reflects new arrivals offset by deportations, voluntary emigration, legalizations, and natural mortality.
- Only 44 percent of the decline in the foreign-born are workers; the rest are children, the elderly, and other non-workers. This fact, along with employment gains by the U.S.-born, mitigates the impact on the labor market and may help explain why the survey of businesses does not show a dramatic decline in workers.
- It is possible that some of the recent decline reflects immigrants’ increased unwillingness to take part in the survey rather than their leaving the country, though we have no clear evidence of this. Survey response rates are not correlated with the size of the foreign-born population. Further, the share of respondents not answering immigration-related questions remains low and unchanged.
- As the report explains, the CPS methodology complicates the story somewhat because a decline in the foreign-born population creates an apparent increase in the U.S.-born population as a statistical artifact.
Introduction
This report is part of a series of recent reports from the Center looking at the size and growth of the foreign-born population in the monthly Current Population Survey (CPS), colloquially known as the “household survey”. The CPS is collected each month by the Census Bureau for the Bureau of Labor Statistics (BLS).1 While the larger American Community Survey (ACS) is often used to study the foreign-born, the most recent version of the ACS reflects only the population through July 2024 and does not reflect the enormous changes in policy in the last 18 months. Even when the 2025 ACS is released later this year, it still will only reflect the population through mid-2025 and will not reflect the Trump administration’s crackdown for the most part. The CPS is the only government survey offering up-to-date information about the foreign-born, which is particularly important in light of the significant shifts in immigration policy during the Biden administration and now the second Trump administration.
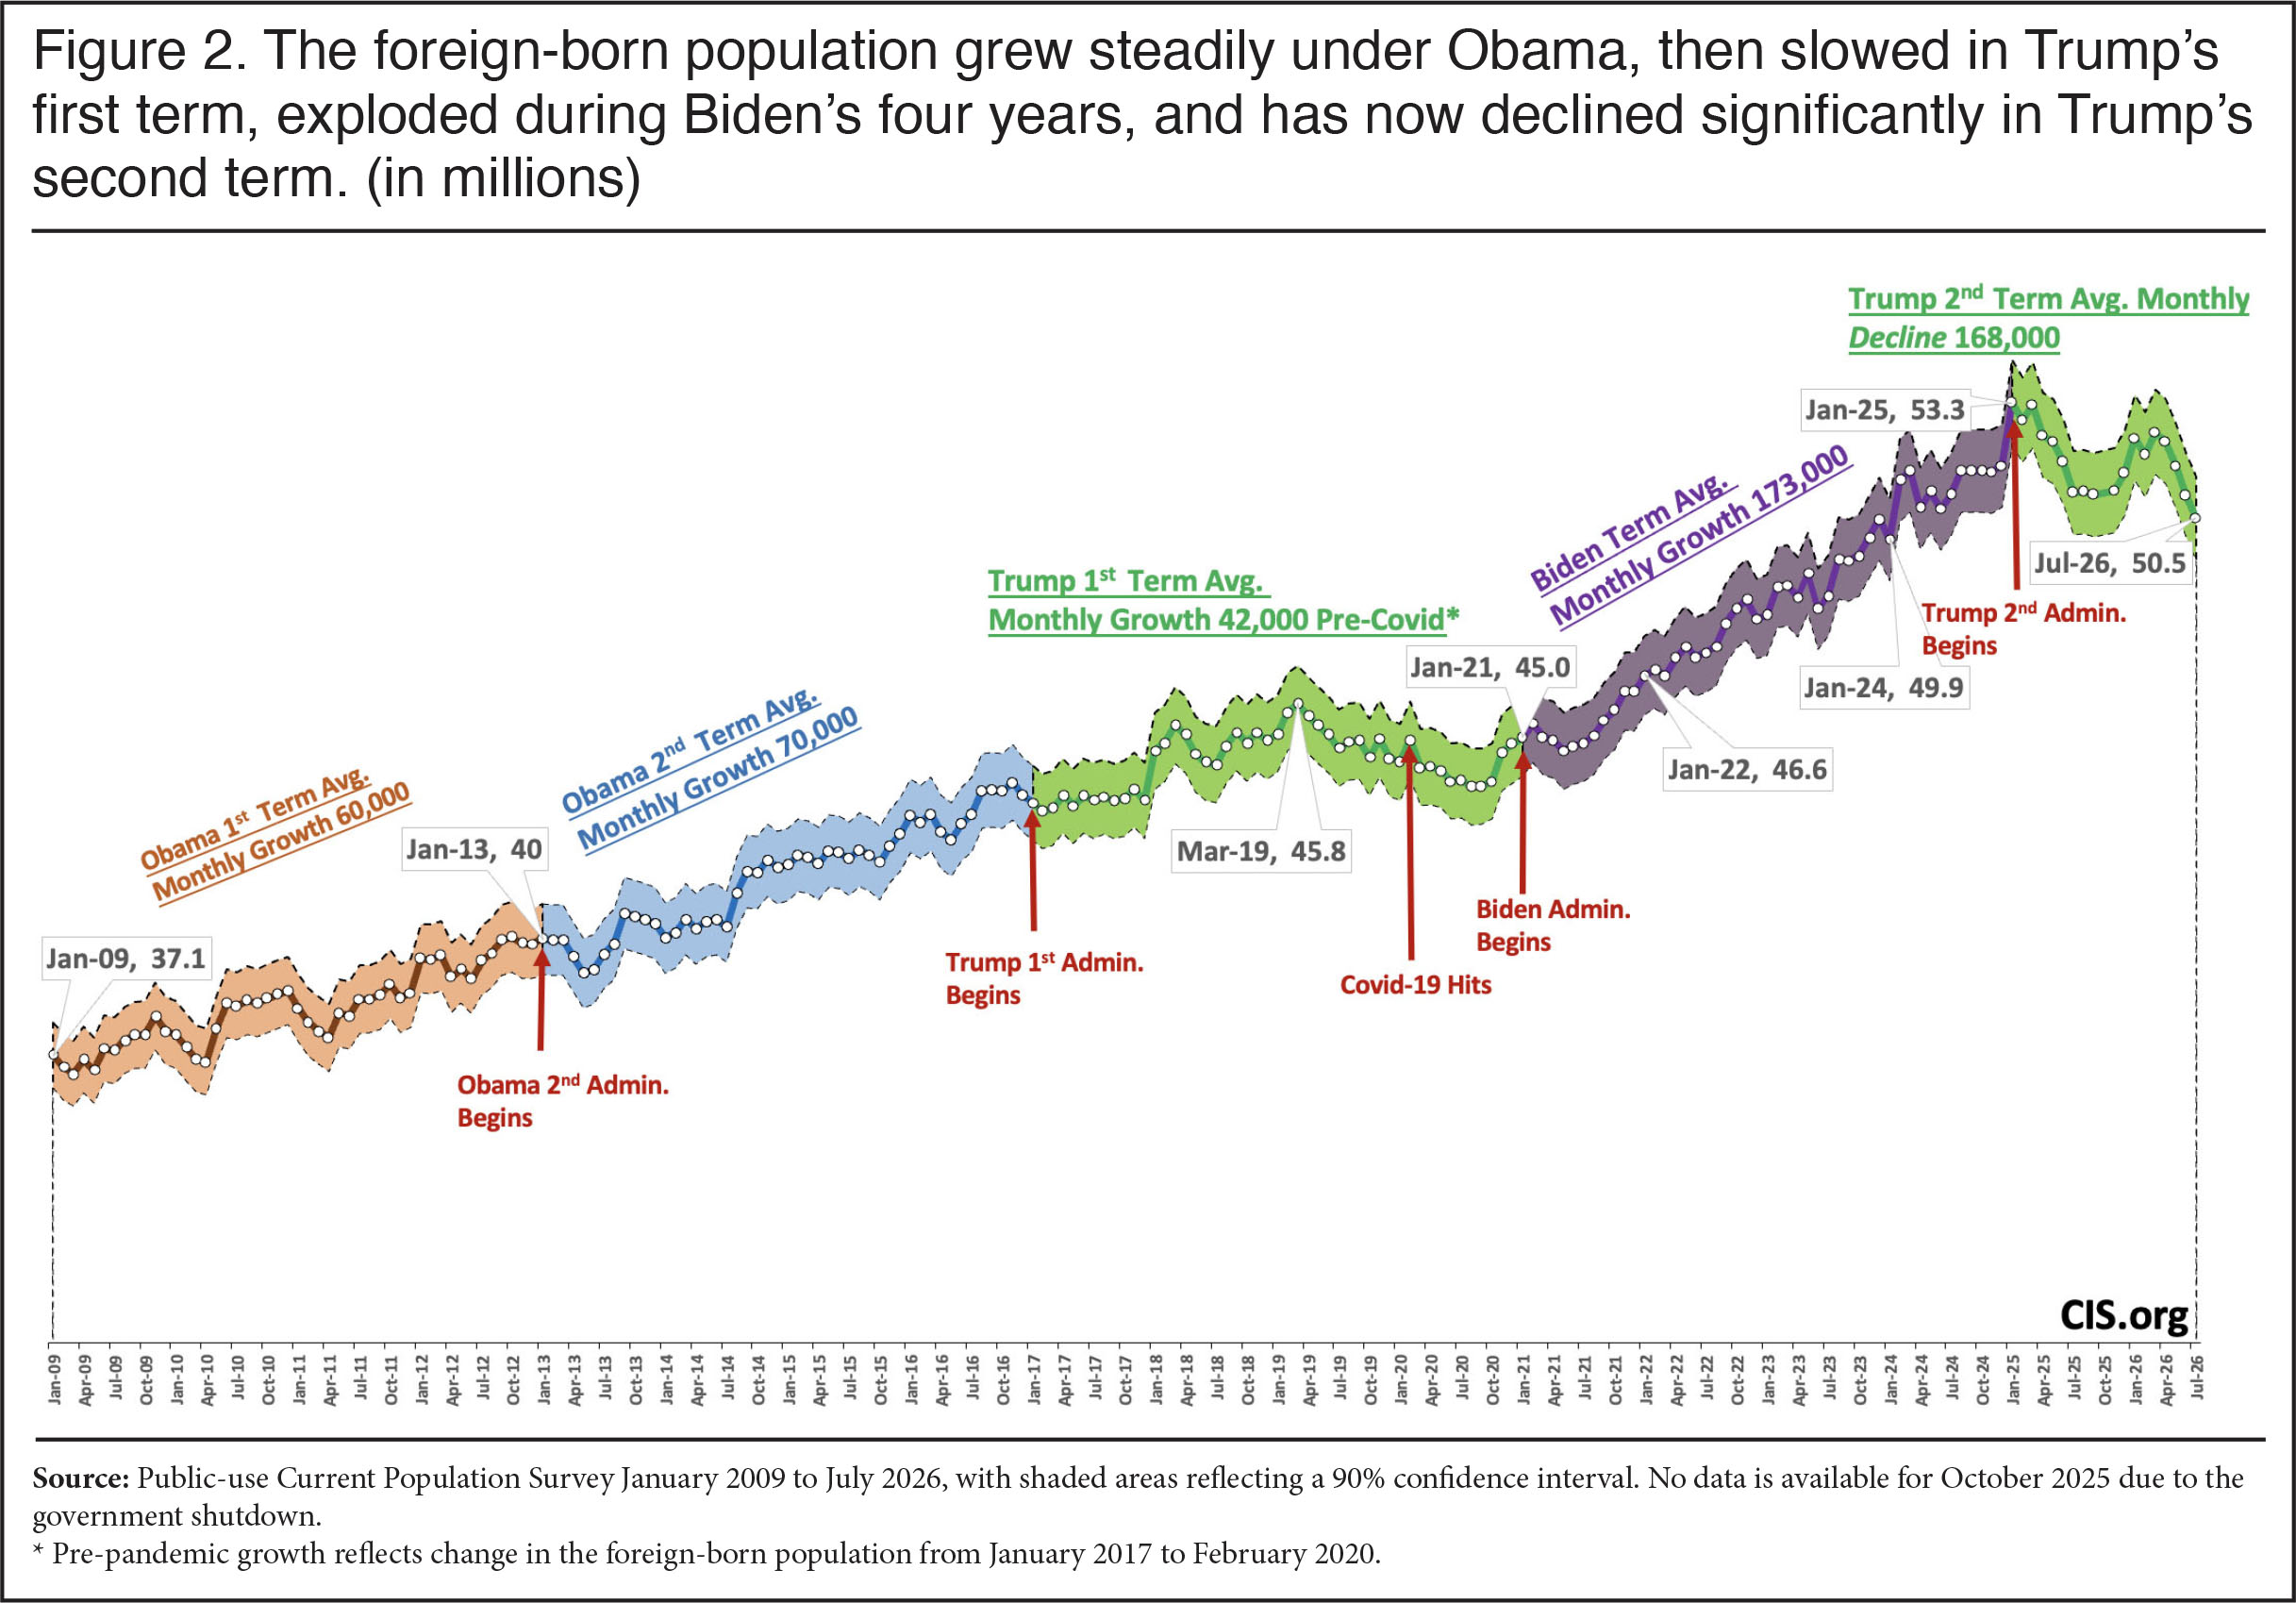
The Household Survey. We use the terms “immigrant” and “foreign-born” interchangeably in this report.2 The more than 50 million total foreign-born residents in July 2026 are all those who were not U.S. citizens at birth — naturalized citizens, lawful permanent residents, long-term temporary visitors such as guestworkers and foreign students (officially referred to as “nonimmigrants”), and illegal immigrants. While the monthly CPS is a very large survey of about 110,000 individuals, the total foreign-born population of 50.5 million in July 2026 still has a margin of error of ±1.038 million using a 90 percent confidence level.3 This means there are numerical fluctuations in the size of this population month to month, though proportionately the confidence interval is equal to about 2 percent each month. Despite the fluctuations, the long-term trend is clearly downward and large.
Using the Survey to Measure Immigrants. Can the CPS be used to measure immigrants and immigration? The Census Bureau itself specifically lists the CPS as one of only two surveys providing information about the foreign-born and publishes detailed tables on immigrants based on the CPS annually.4 It is also the case that the Congressional Budget Office (CBO) uses the survey to measure immigration, and the Social Security Administration (SSA) has used it specifically to measure illegal immigrants. The BLS also publishes CPS-based employment information on the foreign-born every single month, as does the Federal Reserve. Pew Research in August of last year published a report using the monthly CPS showing the decline in the foreign-born population. It is true that a 2024 Census Bureau working paper does caution against using the CPS to estimate the size of the foreign-born population “when other data is available”. But, of course, there is no other up-to-date demographic survey that reflects the Trump administration’s recent crackdown through 2026. The bottom line is that the government and multiple outside research organizations use the CPS to measure the nation’s immigrant population. This analysis is part of that literature.
A Decline in the Foreign-Born
A Large Increase, Then Decrease in the Foreign-born. Figure 1 reports the total number of foreign-born residents in the United States each January from 2009 to 2026 and July 2026, the most recent data available. Comparing January to January, and July of this year, is one way of looking at trends without being distracted by monthly fluctuations given the survey’s relatively large margin of error. Figure 2 shows every month over this same period with a confidence interval around each month. Both figures show that growth during the Biden administration was dramatically greater than in prior administrations. The 8.3 million increase under President Biden was the largest increase in any four-year period in American history.5 Since January 2025 the foreign-born population has fallen by 2.9 million through July 2026. A decline of this size means net migration must have been negative in the last year, a topic we discuss in greater detail later in this report. Further, despite fluctuations in the size of the foreign-born population, the clear upward trend followed by a dramatic downward trend does track well with changes in the nation’s immigration policies, from a highly permissive approach to immigration during the Biden administration to the more restrictive policies during the second Trump administration.
 |
 |
Net Change in Population. When thinking about the dramatic increase in the foreign-born population from 2021 to 2025 followed by the steep decline after January 2025, it is important to remember that they represent the net change — not the number of new arrivals or departures. Newly arrived lawful permanent residents (LPRs), non-immigrants, and illegal immigrants add to the foreign-born population each month. In addition to natural mortality, others leave the foreign-born population due to voluntary emigration and deportation (formally called removals). The foreign-born population can only grow from new arrivals, since all births to immigrants (legal or illegal) in the United States add only to the native-born population by definition.
Weighting of the Data. Like virtually all modern surveys, the CPS is weighted to reflect the size and composition of the total population. The Center has discussed the impact of the sample weights used in the CPS and their implications for understanding changes in the size of the foreign-born population in Census Bureau-administered surveys in multiple publications. What is important here to understand is that the readjustment to the weights is done each January and then carried forward throughout the rest of the year in what is essentially a linear projection. The monthly projections used to create the weights can be found here. The Census Bureau’s readjustment each January reflects updated information on births, deaths, and estimated net international migration (NIM), the difference between the number entering and leaving the country. The weights control the population to certain key demographic characteristics such as race, sex, age, and Hispanic origin. The January 2026 readjustment resulted in an upward shift of 874,000 in the number of immigrants compared to December 2025 because the bureau felt that certain groups had been underrepresented in the 2025 weights.6
It is critically important to understand that citizenship, like unemployment, is not a control variable and is allowed to vary based solely on responses to the survey.7 Despite the significant upward adjustment in racial groups that caused the foreign-born population to increase in January 2026, when 2025 and 2026 are looked at separately using within-year consistent survey weights, they show a 1.7 million decrease January to December in 2025 and a two million decrease January to July in 2026. These within-year declines on their face provide powerful evidence that the foreign-born population has fallen dramatically during the Trump administration independent of any reweighting of the data.
The Apparent Increase in the U.S.-Born. The CPS shows the U.S.-born population was about 4.7 million larger in July 2026 than it was in January 2026. Because of the way the survey is weighted, a decline in the foreign-born mechanically must result in an increase in the U.S.-born. But that is a statistical artifact due to the fact that the survey is controlled to a predetermined overall population size. As a result, the survey can pick up a change in the size of the foreign-born population, but it cannot measure changes in the overall size of the U.S. population or corresponding changes in the size of the U.S.-born population. Virtually all modern surveys are weighted. As already noted, the weights in the CPS are readjusted each January based on updated estimates of the entire U.S. population. Some people who lack a full understanding of how weighted surveys work may mistakenly think the apparent growth in the U.S.-born population somehow invalidates the finding that the foreign-born population is falling. This is not correct. Being foreign-born is a characteristic based solely on survey responses. It is not a weighted variable controlled to predetermined population totals. The size of the foreign-born population is like the unemployment rate; it can fluctuate in any direction depending on what the survey takers find in the field.
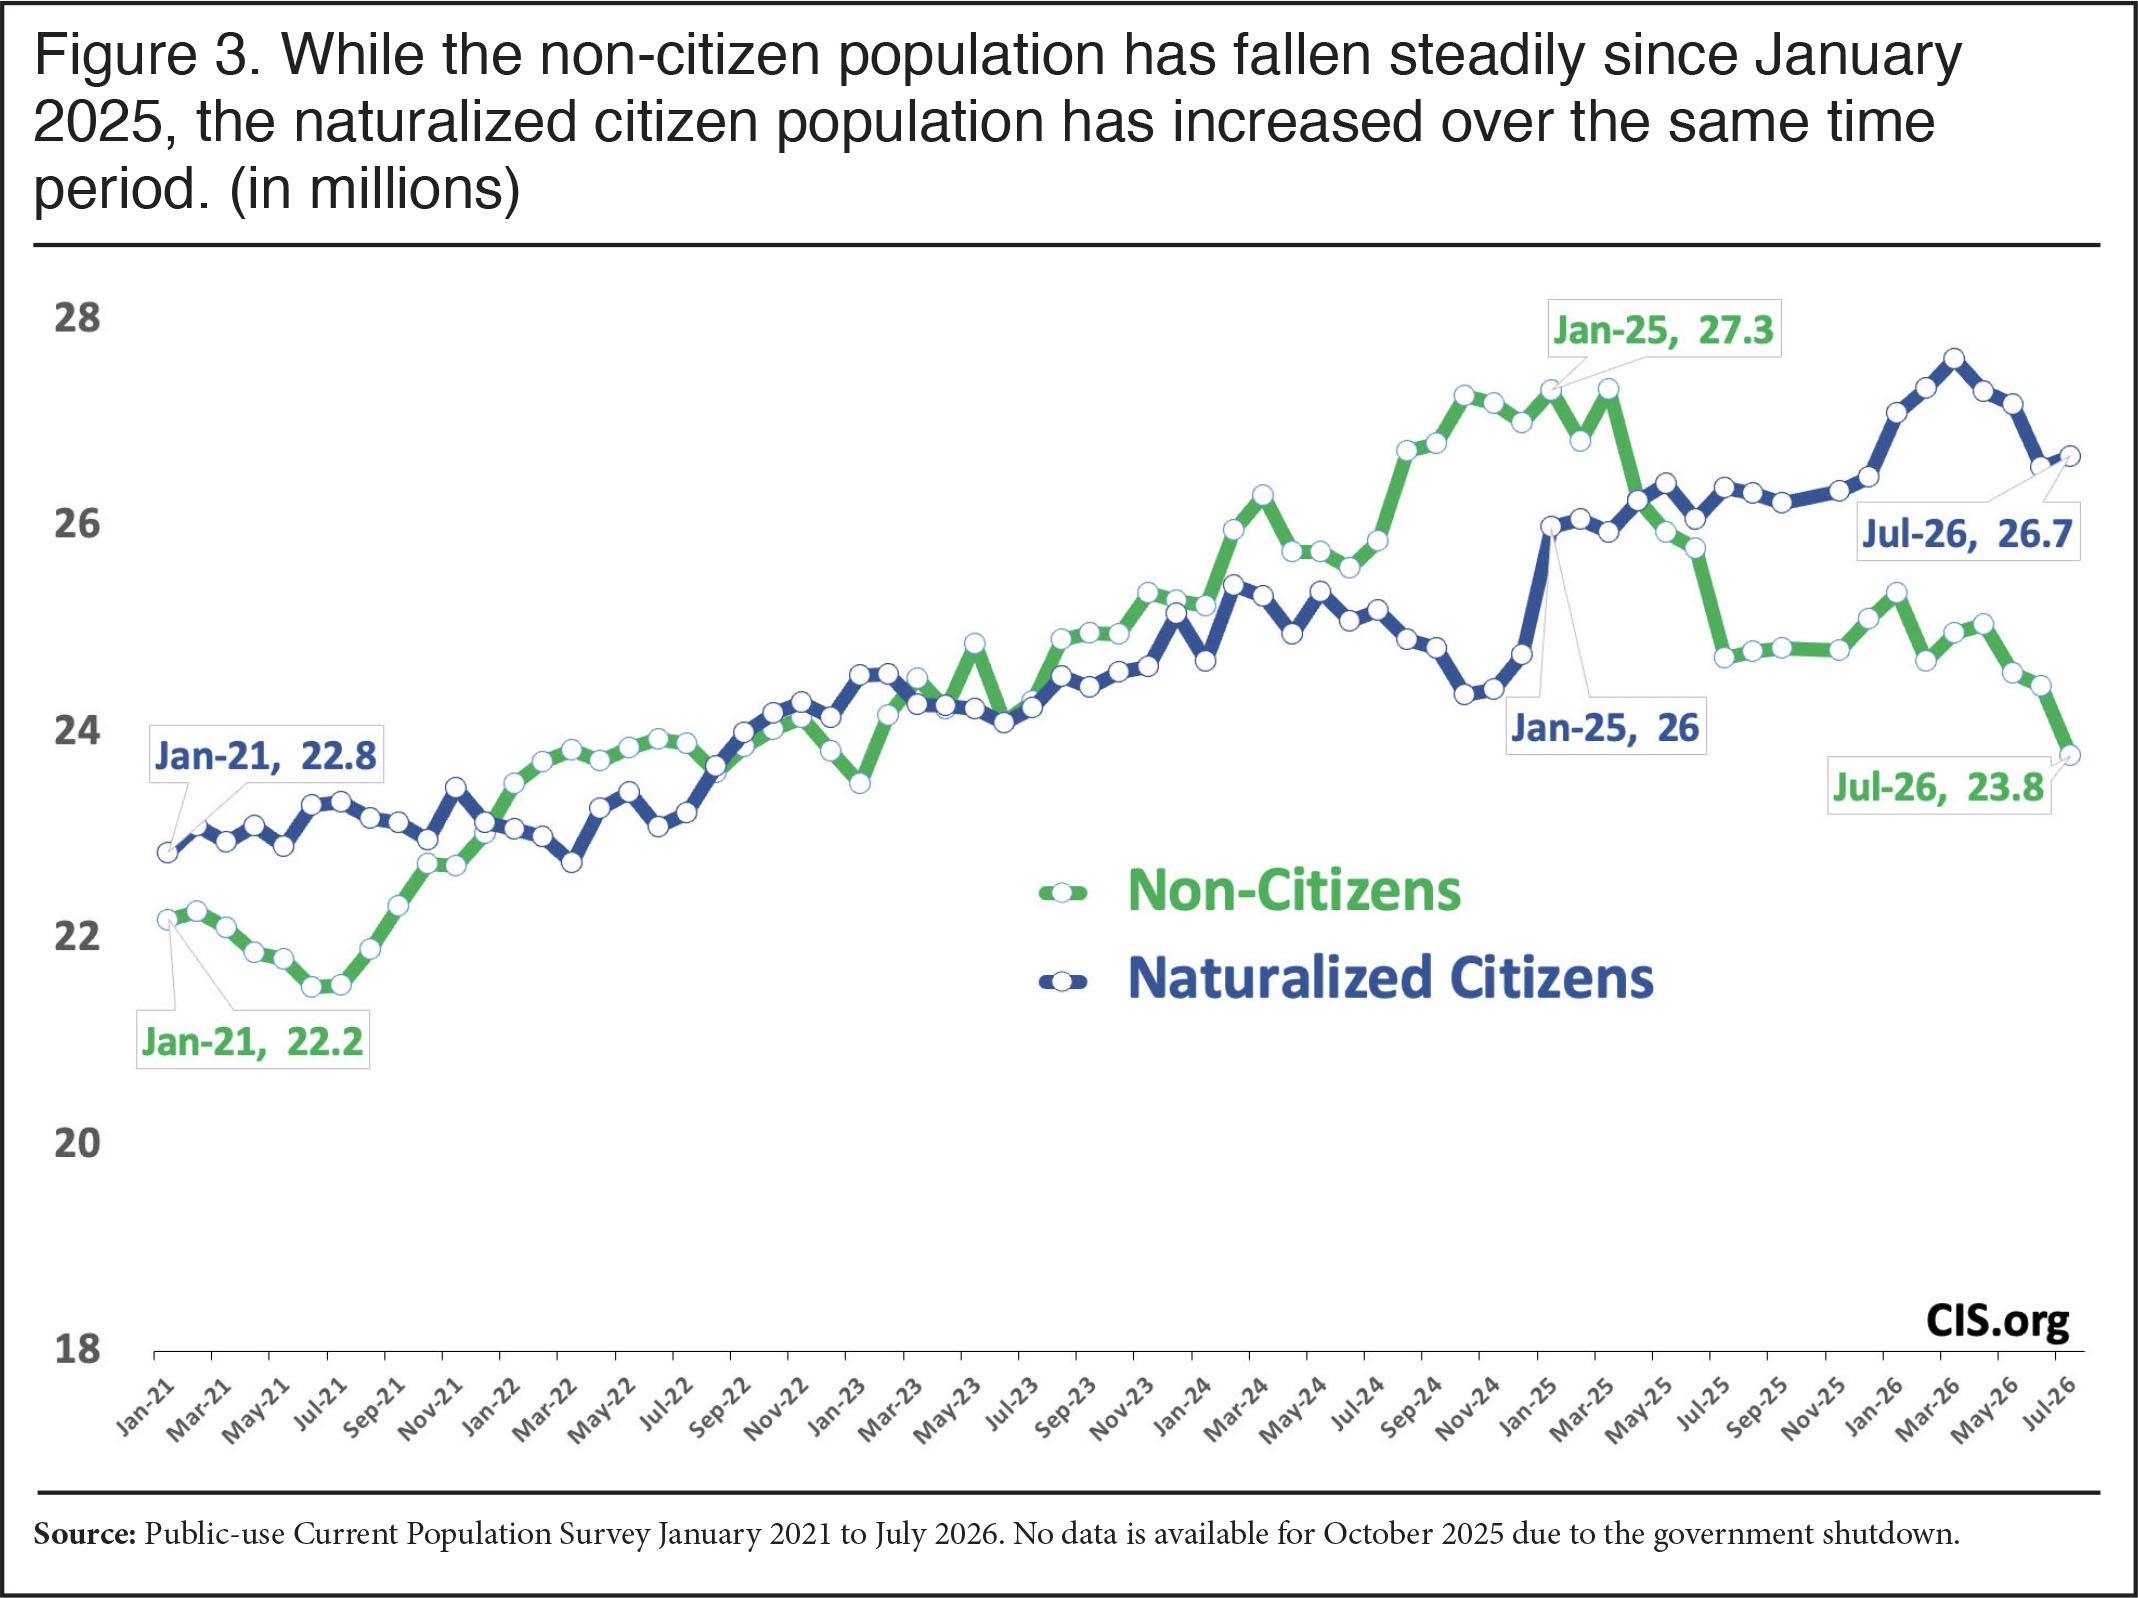
Non-Citizens and Naturalized Citizens. Figure 3 reports the number of people who are not U.S. citizens and the number who are naturalized citizens since January of 2021. While the number of non-citizens has fallen dramatically since January 2025, the citizen population has actually increased by about 680,000 over the same period. This means that the decline in the number of foreign-born since January 2025 is entirely due to a fall-off in non-citizens.
 |
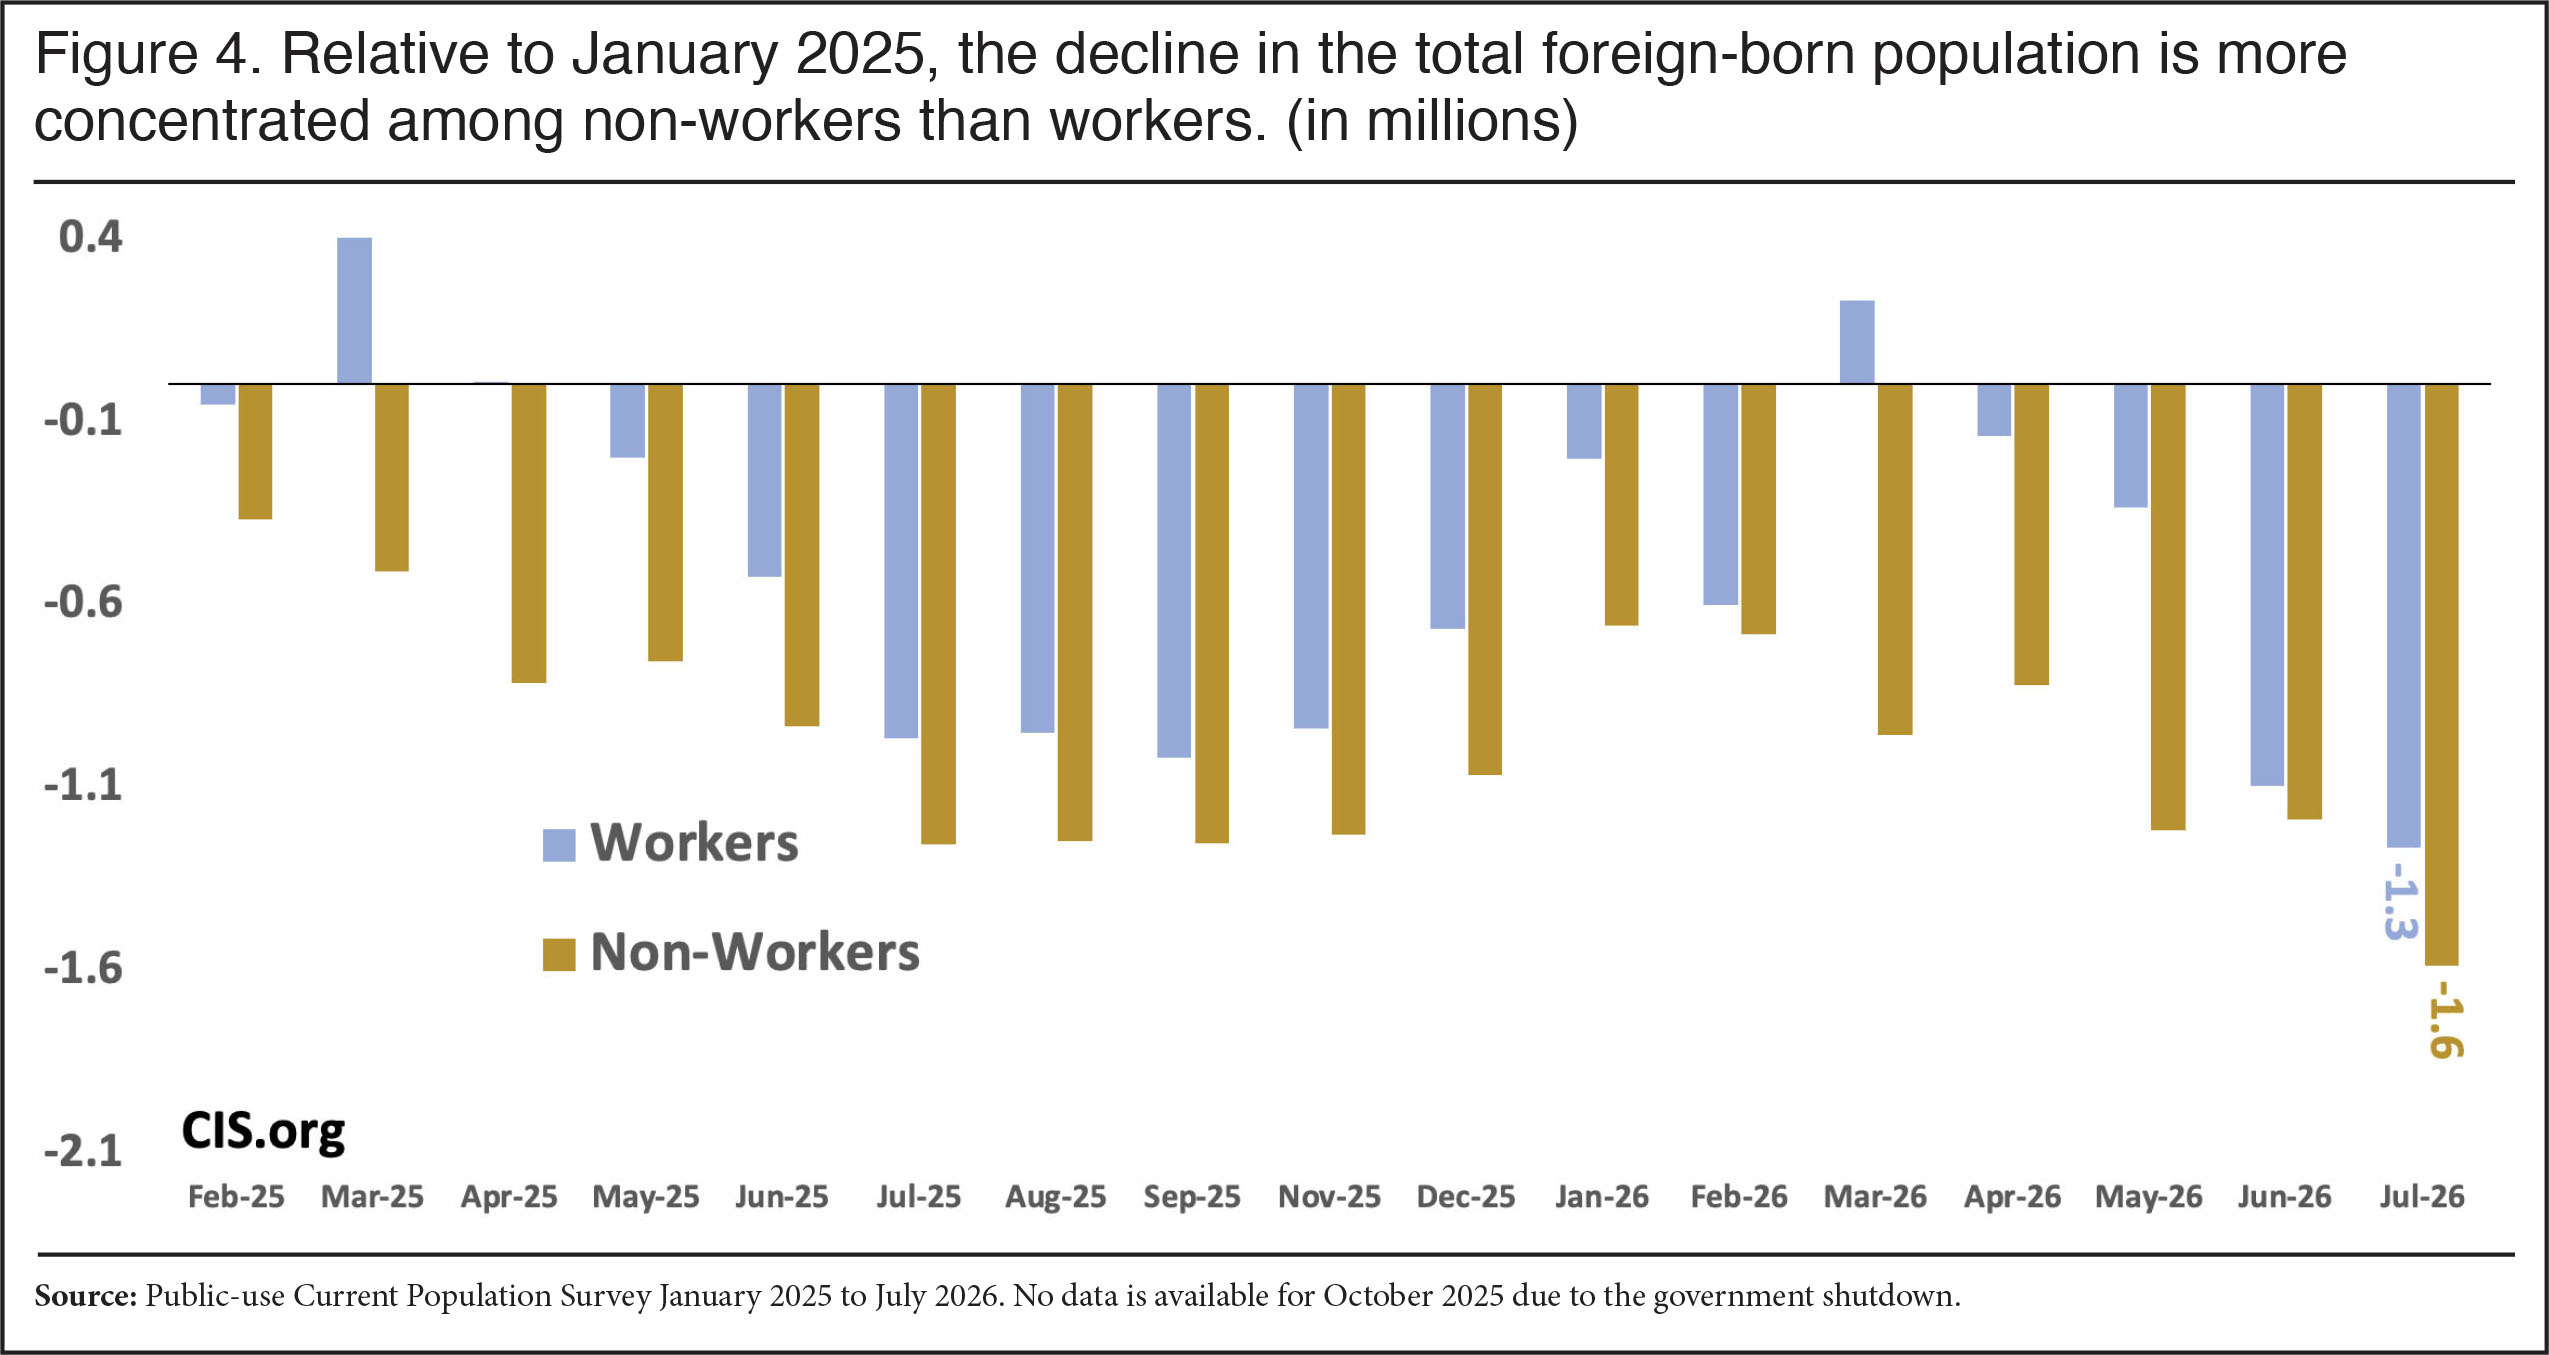
Most of the Decline Is Among Non-Workers. Figure 4 reports the decline in the number of foreign-born residents who are working vs. those who do not work, with January 2025 as the starting point. The number of immigrant workers has declined by a little less than 1.3 million, but the number of non-working immigrants is down 1.6 million. Overall, only 44 percent of the decline in immigrants is among workers, even though 60 percent of the foreign-born were workers in January 2025. Those who are not working are primarily children, the elderly, full-time caregivers, and others who are not employed. The disproportionate decline among non-workers, along with employment gains by the U.S.-born mitigates the labor market impact of the decline in immigrant workers and may help explain why the survey of businesses that measures nonfarm payroll employment still shows an increase in jobs held.8
 |
Estimating Illegal Immigrants
Our General Approach. The Center has used the Current Population Survey in the past to estimate the illegal immigrant population in the United States. The survey does not specifically identify illegal immigrants; but, like other researchers, we use the information in the survey, and other information from outside the survey, to estimate the population living in the country without authorization. As we have described in our earlier analysis, we follow DHS’s Office of Homeland Security Statistics approach and first estimate the legal immigrant population that arrived in 1980 or later, allowing for deaths and outmigration, and then subtracting this estimate from the foreign-born population in the survey. (Those who arrived before 1980 are almost certainly not illegal.9) We defined illegal immigrants as all foreign-born residents who are not naturalized citizens, permanent residents, or who have valid temporary visas. Our estimate of illegal immigration does include those with pending asylum applications and parolees.10
Fewer Legal Entrants. There is good evidence that the number of new legal entrants (LPRs and non-immigrants) entering the country has declined, especially in fiscal year 2026, which began in October 2025. Looking at the available administrative data, numerous immigration advocates and groups have found that the number of green cards issued has fallen significantly. Universities reported fewer foreign students in 2025 and media accounts and advocates for foreign students make the same argument.11 The most recent Adjustment of Status Report shows a steady decline each quarter in FY 2025 in the arrival of new LPRs, though no FY 2026 data is available. The number of refugee arrivals (who normally become LPRs after a year) was dramatically lower in FY 2025 than in FY 2024, and based on data through June 2026 there will likely be about 90,000 fewer refugee arrivals in FY 2026 than in 2024. However, estimating how much the arrival of all legal immigrants (LPRs and non-immigrants) may have declined after February 2025 is not really possible because the State Department has not released data on new visas since then and, as already pointed out, updated LPR data is also lacking.
Illegal Immigrants in the CPS. Based on prior trends and the limited administrative data available, we preliminarily estimate that the post-1980 legal immigrant population was 31.6 million in July 2026.12 Subtracting this number from the 44.7 million post-1980 immigrants in the July CPS produces an estimate of 13.1 million illegal immigrants in the data.13 Making the same adjustment for undercount in the data as we did in our earlier analysis puts the total illegal immigrant population at 13.5 million in July 2026. If correct, this would represent an extraordinary decline of 2.3 million, or 14.6 percent in the illegal immigrant population since January 2025 (see Figure 5). It should be emphasized that the decline represents the total net change in the overall size of the illegal population, and reflects new arrivals offset by deportations, voluntary emigration, mortality, and legalizations.
 |
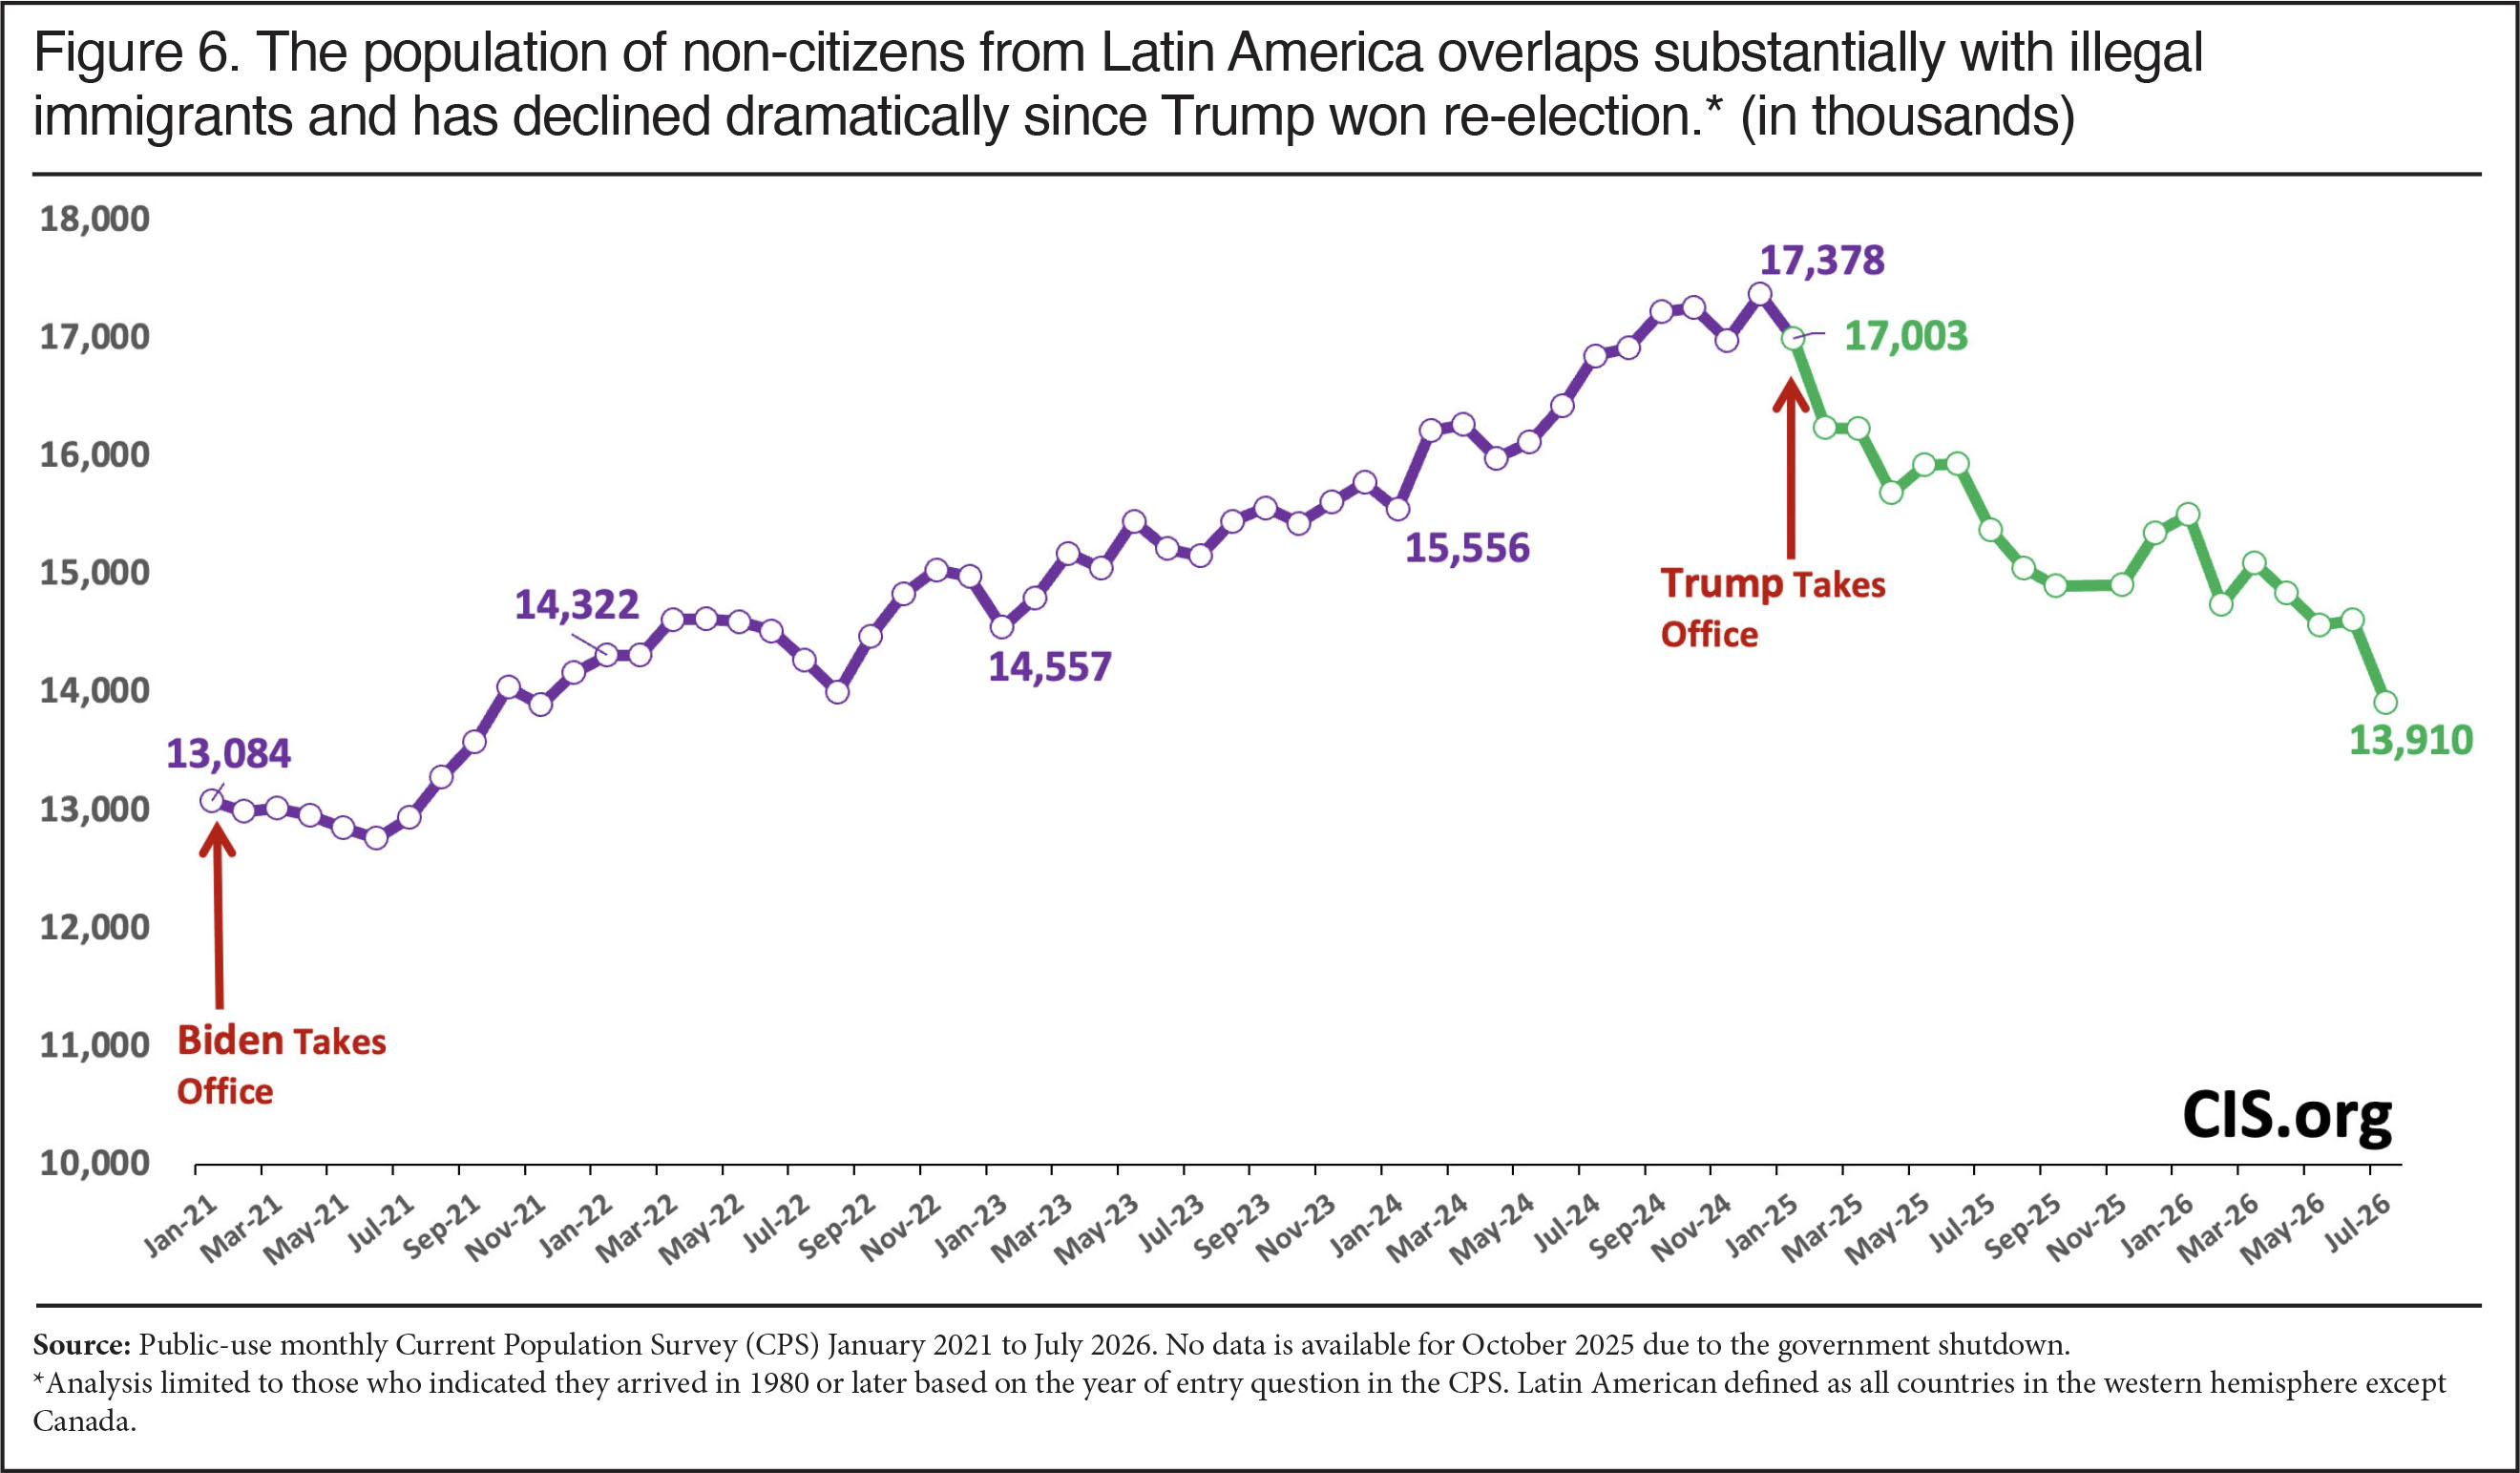
Decline in Non-Citizen Latin Americans. Respondents to the CPS are asked when they came to the United States. As already discussed, illegal immigrants should show up in Census Bureau surveys as having arrived in 1980 or later. They should also identify as non-citizens. Prior research by DHS, the Pew Research Center, the Center for Migration Studies, and the Migration Policy Institute all indicate that roughly three-fourths of illegal immigrants are from Latin America. We also know that roughly 80 percent of those encountered at the nation’s borders during the border surge were from Latin American countries. As a result, the size of the non-citizen Latin American population who arrived in 1980 or later is highly correlated with the illegal immigrant population. Figure 6 shows the number of post-1980 non-citizen Latin Americans increased dramatically from January 2021 to December 2024, and since January 2025 their number have declined precipitously. Without making any assumptions about legal or illegal immigrants in the data, these results strongly support the idea that the election of Donald Trump, his rhetoric, high-profile enforcement actions, and border policies have caused a very large decline in the number of illegal immigrants in the country.
 |
Is the Decline Real?
Deterioration in Data Quality. Are there actually fewer immigrants in the country or are they still all here but more of them have stopped identifying as foreign-born or have simply stopped responding to the CPS altogether due to increased immigration enforcement? We find no clear indication that the survey’s ability to capture the foreign-born has fundamentally deteriorated. In a prior analysis looking at the decline of the overall foreign-born population through August of last year, we did not find evidence that immigrants in general have suddenly become less willing to take part in the CPS. There is no indication that respondents are increasingly unwilling to answer immigration-related questions such as providing their country of birth or citizenship.14 Moreover, looking at the most recent data, we also see no indication that non-citizens are increasingly claiming to be naturalized citizens, as there was no sudden surge in the number of naturalized foreign-born residents in 2025 and 2026 (see Figure 3). Rather, the number of naturalized citizens has increased in a manner similar to the past and in a way that is broadly consistent with administrative data on naturalization. The increase in naturalized citizens is itself an indication, at least to some extent, that foreign-born residents in general are still willing to respond to the survey.
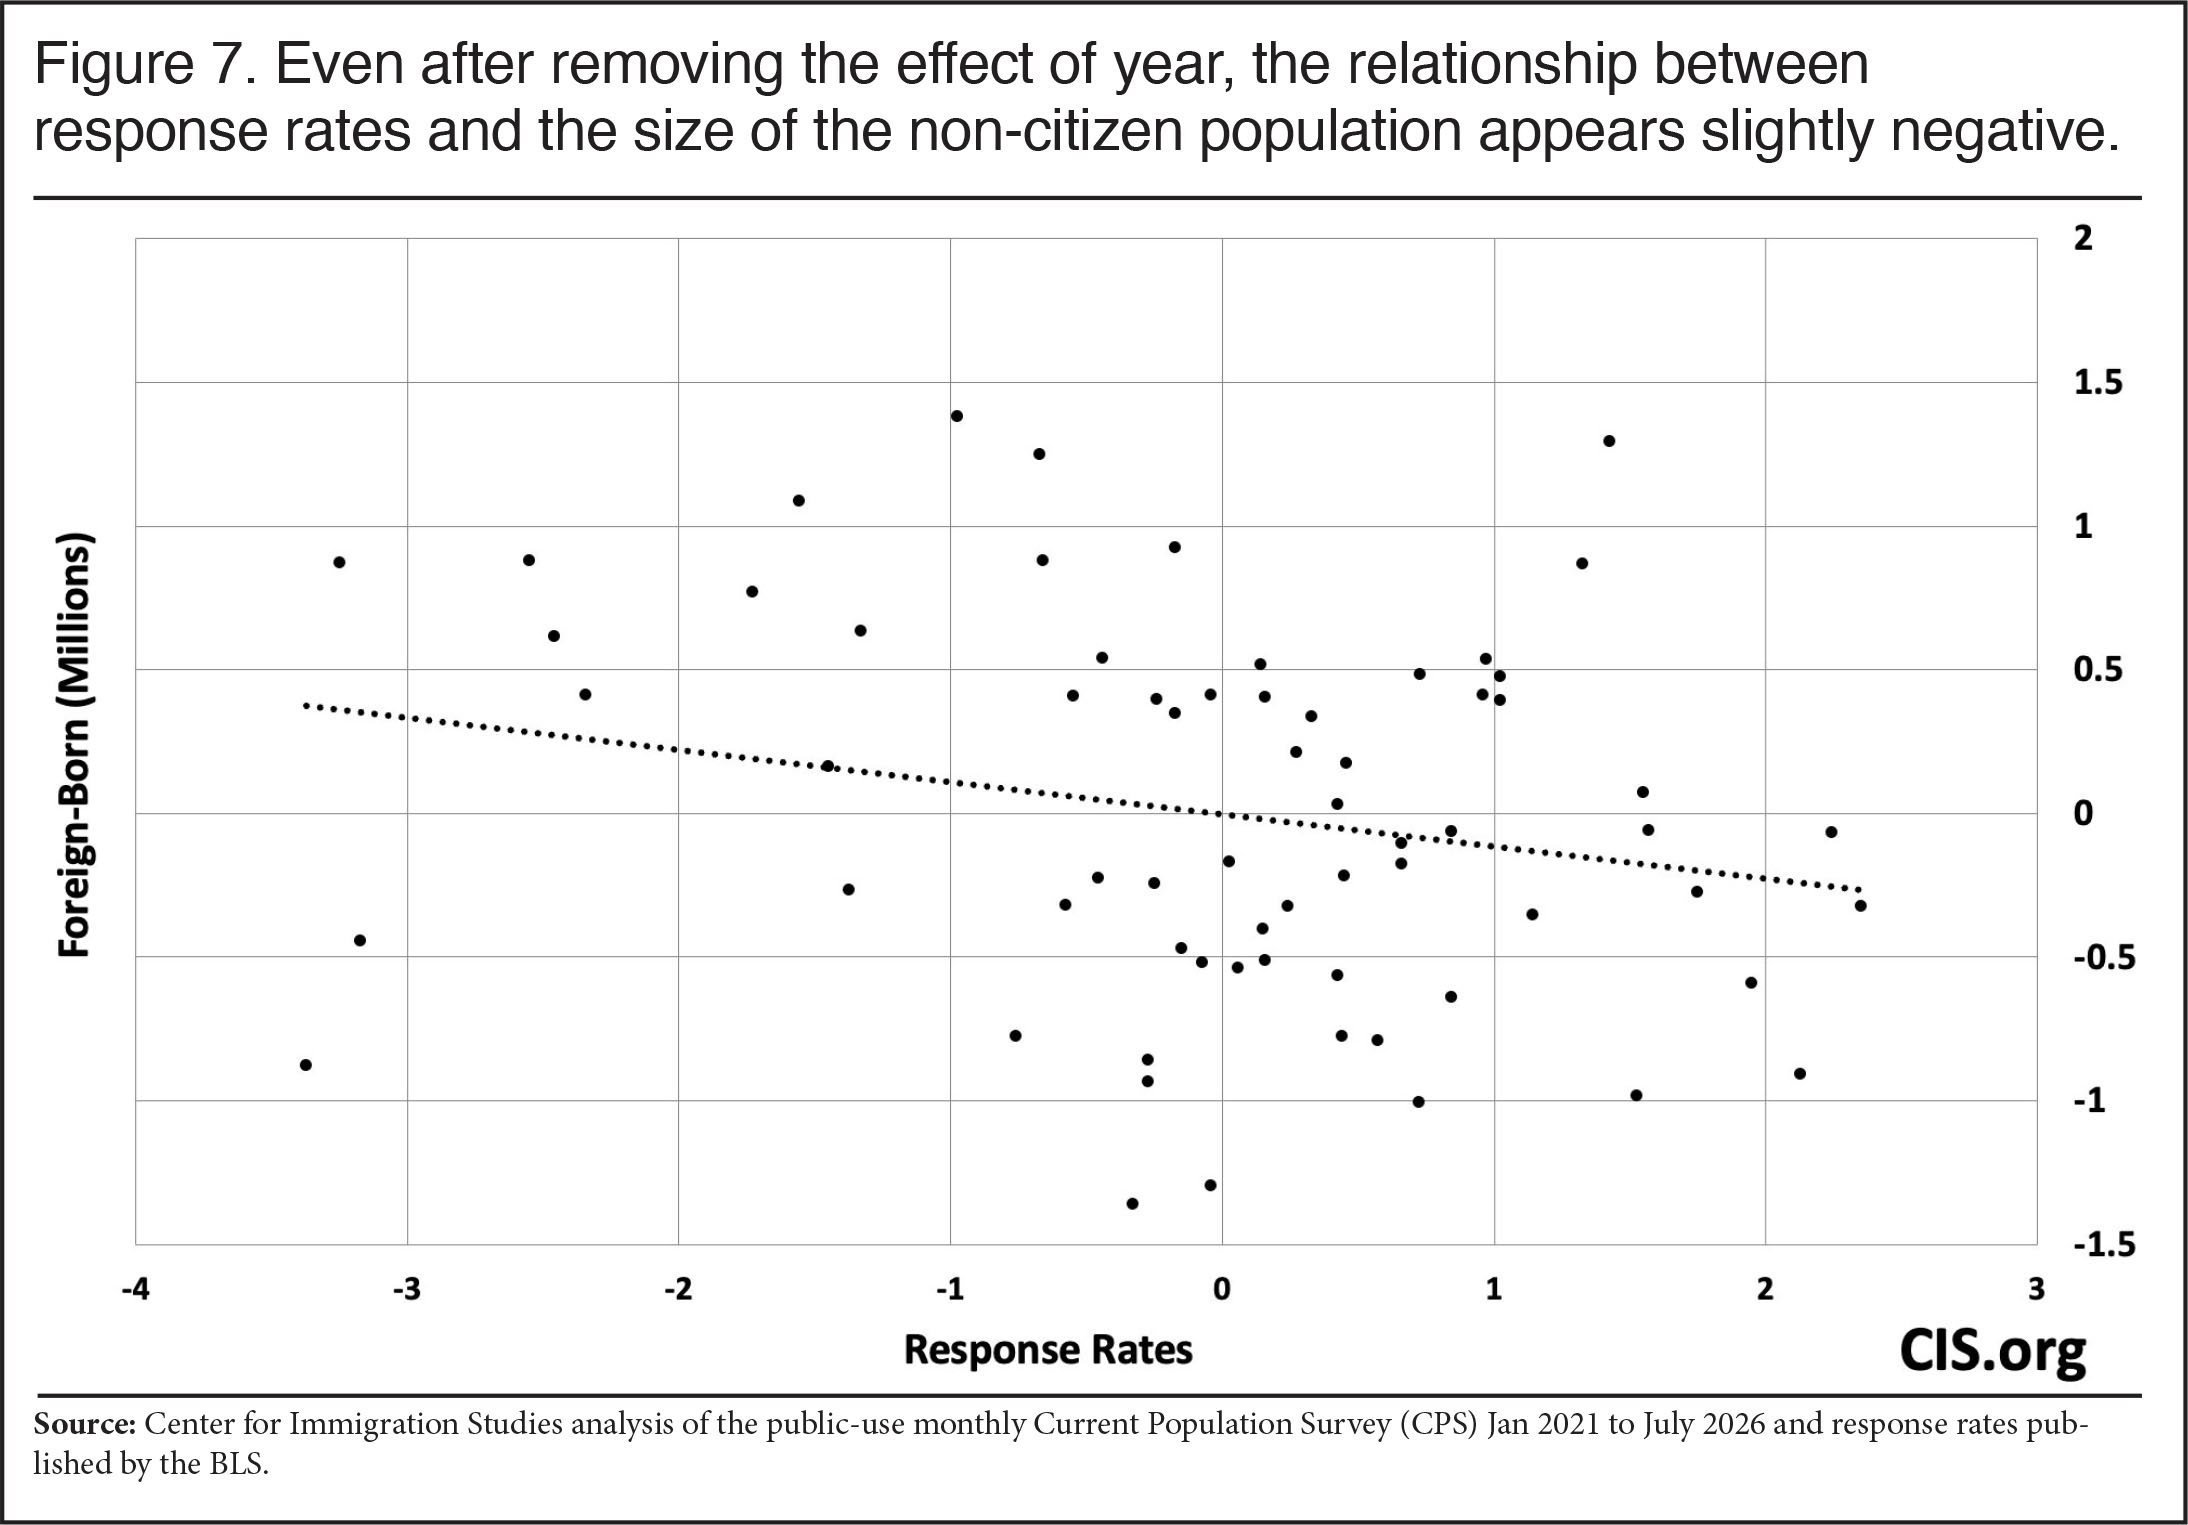
CPS Declining Response Rates. There is no question that for more than a decade response rates to the CPS have declined. But this does not seem to account for recent trends in the number of immigrants. If the decline in response rates explained the fall-off in the foreign-born in the last year and a half, then response rates and the number of foreign-born residents showing up in the survey should be correlated. But the correlation from January 2021 to July of 2026 in these two numbers is -.89.15 This means that, as the response rate increases, the immigrant population in the survey goes down. Of course, this correlation is not very meaningful because the size of the foreign-born population grew dramatically from 2021 to the start of 2025 during the border surge; it then declined thereafter, while response rates fell continually through both periods. Since the period and size of the decline in the foreign-born is longer and larger than the period of increase it is to be expected that the relationship would be negative.
We can remove much of the impact of the long-term trend in response rates and coinciding long-term trends in the size of the immigrant population upward from 2021 through 2024 and then downward in 2025 and 2026 by including year as a control variable when regressing the size of the immigrant population on the response rates for each month.16 When we do so, we still find that a higher response rate is not associated with a larger foreign-born population. The regression shows each one percentage-point increase in the response rate to the survey is accompanied by a 110,000 decline in the size of the immigrant population.17 Figure 7 shows a scatter plot of the residuals after removing the effect of year. The figure indicates there is not a strong relationship between response rates to the CPS and the size of the foreign-born population even when we remove the effect of year.18 The long-term decline in CPS response rates is certainly a worrying trend, but it does not seem to be related to fluctuations in the number of immigrants in the survey.
 |
Decline in Hispanics in the Survey. As already noted, the CPS is weighted to reflect the size and composition of the total population; and the weights are readjusted each January. In recent years, nearly half of the foreign-born in the CPS identify as Hispanic. Further, prior research indicates that roughly three-fourths of illegal immigrants are Hispanic. Therefore, looking at the number of Hispanic respondents in the survey should provide some insight into immigration trends independent of the reported size of the foreign-born or illegal immigrant population.
The top line in Figure 8 shows a steady increase in the size of the total weighted Hispanic population (native and foreign-born). Being Hispanic is a control variable and the steady increase is a mechanical artifact due to the survey weights and reflects the bureau’s assumptions that both net migration and natural population growth (births minus deaths) add to the Hispanic population each year. This causes the number of Hispanics in the survey to increase each month once the data is weighted. The top line also shows the upward shift in the number of Hispanics that occurs with each January readjustment.19 While there is fluctuation, the lower line shows the number of Hispanic respondents in the survey’s unweighted data started to decline at the end of 2024. The number of Hispanic respondents declined 7.4 percent from January 2025 to July 2026. It is a 10.1 percent decline if December 2024 is used as a starting point.
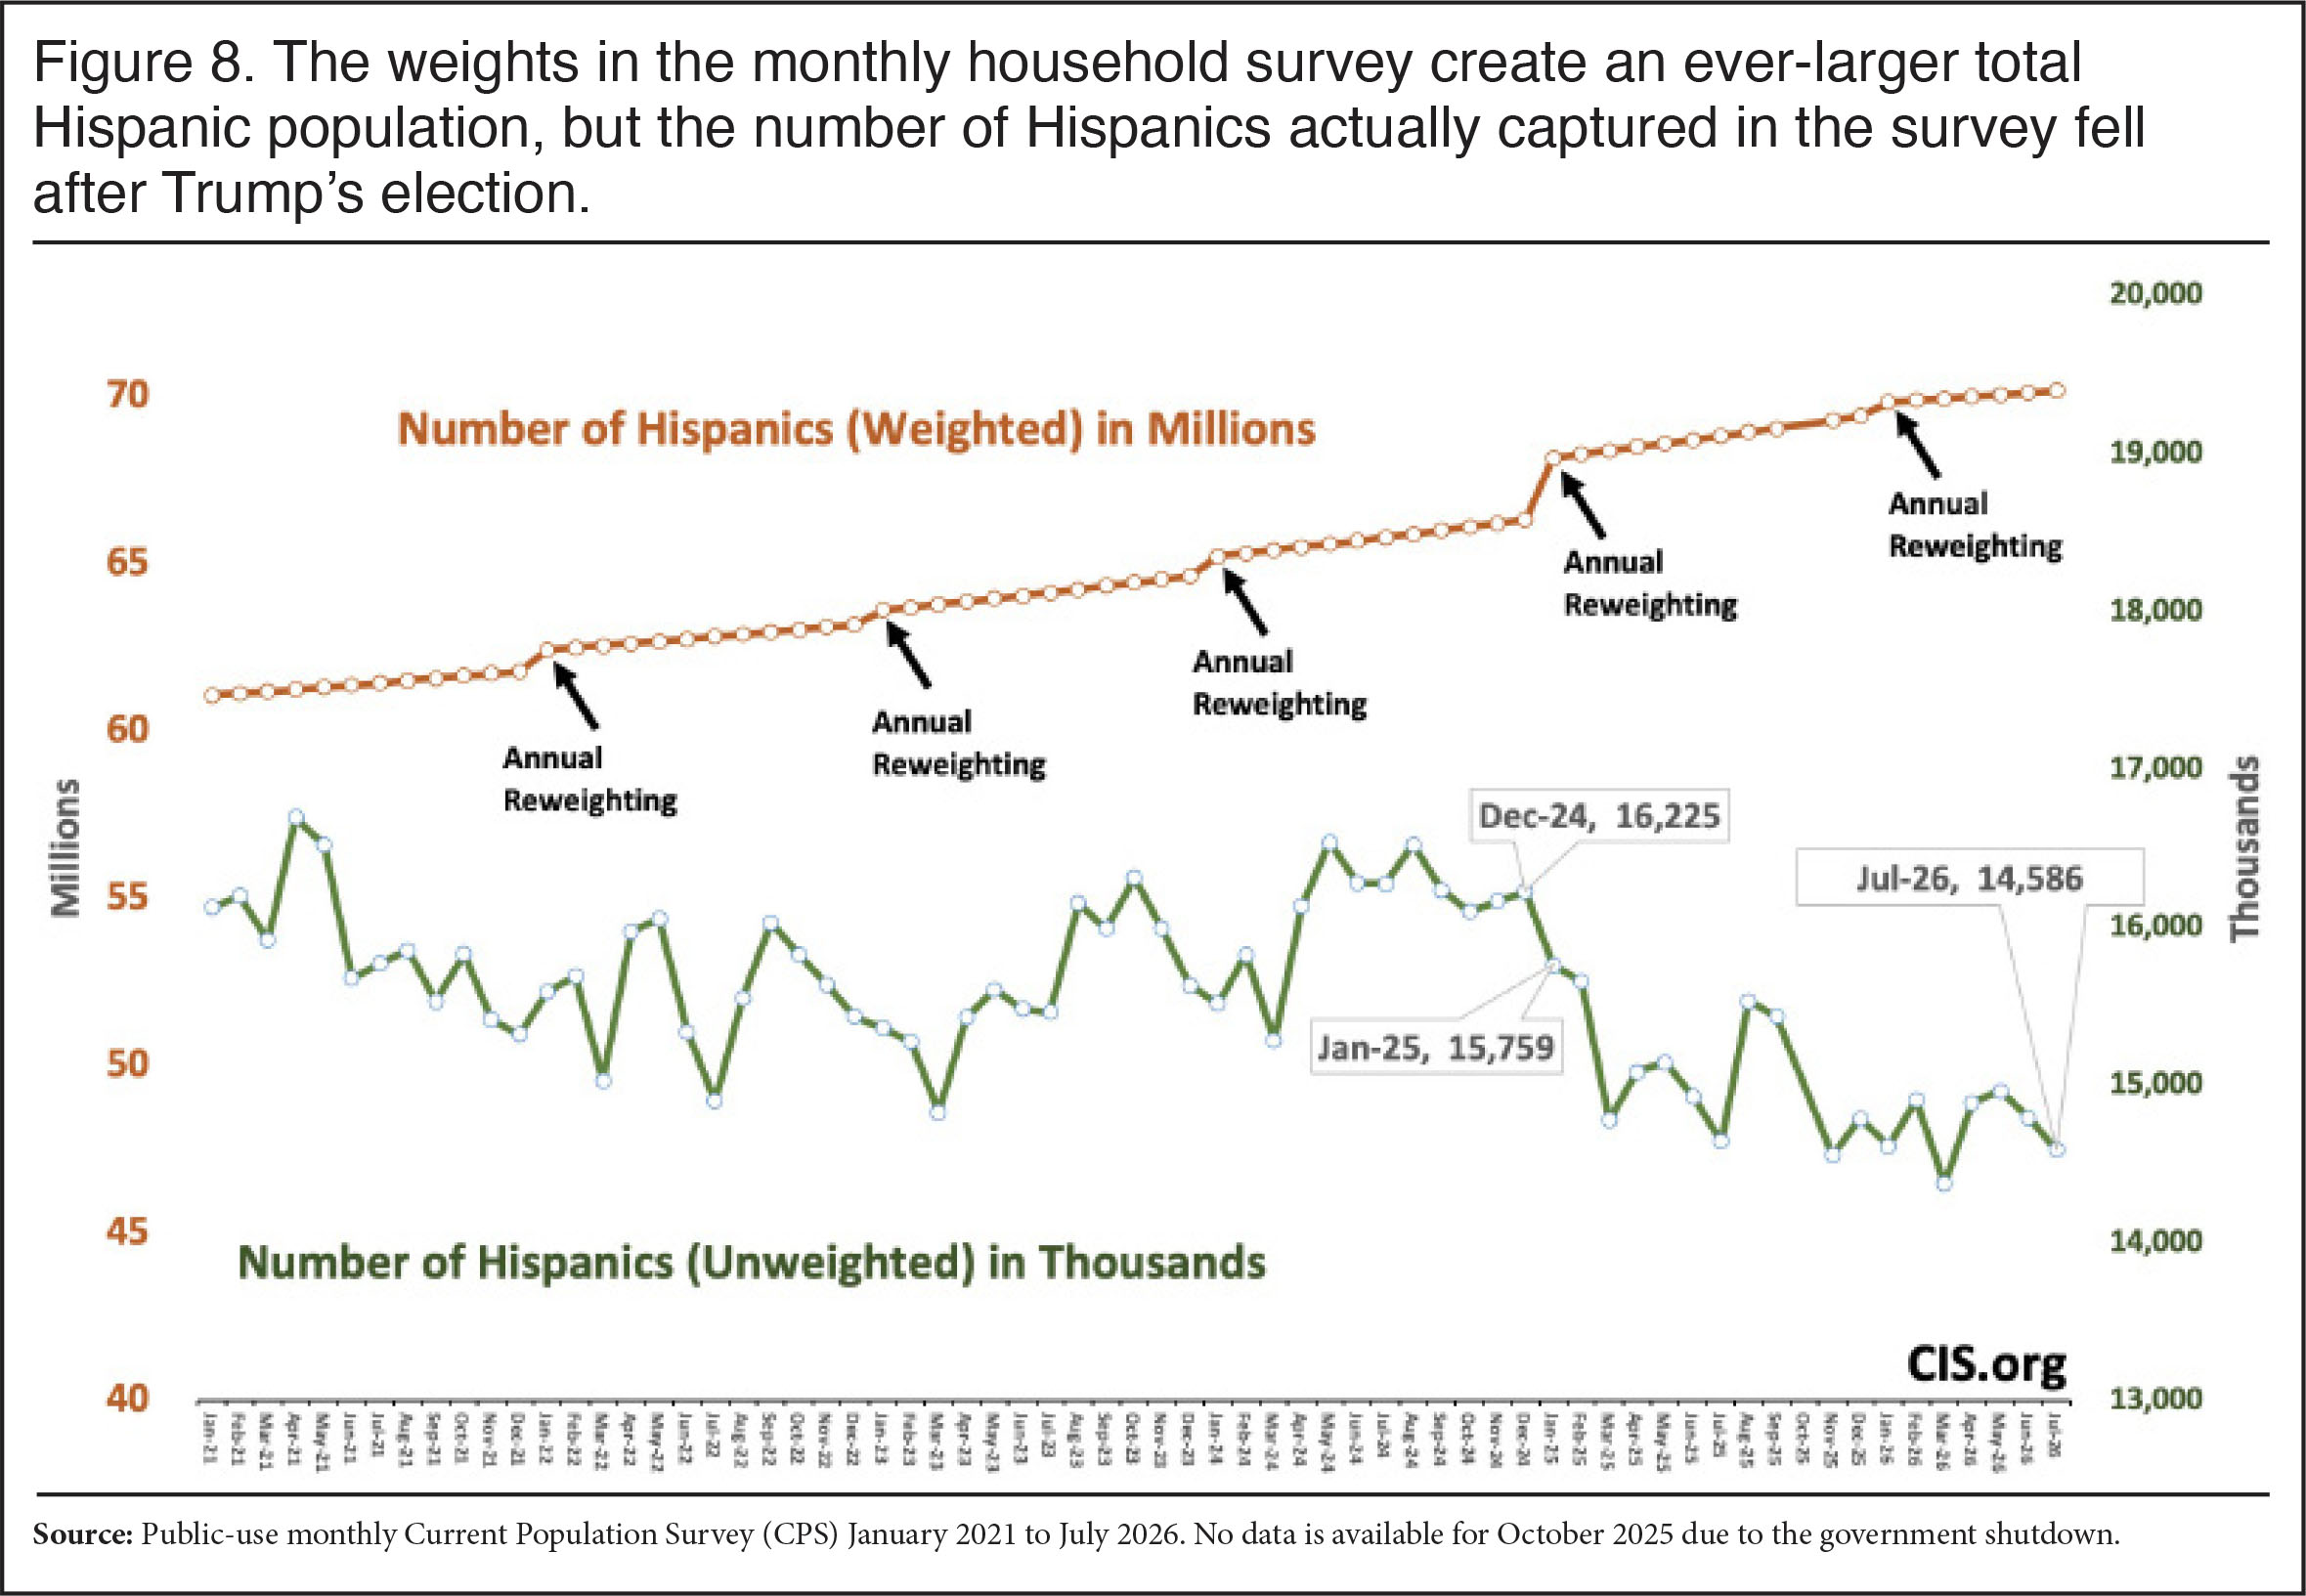 |
If immigrants in general or illegal immigrants in particular were still in the country, but claiming to be U.S.-born, then we would expect the number of Hispanic respondents in the unweighted data to stay relatively constant even if fewer were willing to identify as foreign-born. The fall-off in the number of unweighted Hispanic respondents is consistent with foreign-born Hispanics leaving the country. However, it is also possible that Hispanics are still here but are not taking part in the survey. What is clear is that fewer Hispanics are responding to the CPS, rather than the number remaining relatively constant but with more claiming to be U.S.-born or naturalized citizens.
Could Emigration Really Be Large and Negative? Taken at face value, the 2.9 million decline in the foreign-born population from January 2025 to July 2026 means the number who left must be much higher than the number of new arrivals. As noted, the Census Bureau uses the concept of “net international migration” to reflect the difference between the number coming vs. the number leaving. For the total foreign-born to decline this much, net migration would be about -2.45 million from January 2025 to July 2026, which equals the change in the foreign-born (-2.9 million) minus expected natural mortality (450,000). On an annualized basis it would be -1.63 million. When it released its 2025 estimate of NIM, the Census Bureau projected that net migration would be 321,000 from mid-2025 to mid-2026. (Estimates of NIM run from July to June each year.) This represented a huge decline from prior years, but it was still positive.20
In contrast to the bureau’s relatively small but positive projection of NIM for 2026, the results from the CPS over the last year and a half indicate a large negative value. But there are several things to consider about the Census Bureau’s NIM projection vs. what the CPS indicates. First, the survey’s large margin of error means the actual decline in the total foreign-born population could be as little as 763,000 from January 2025 to July 2026, assuming the bottom of the confidence interval in January 2025 and the top of the confidence interval in July 2026.21 This would translate into net migration of -313,000 from January 2025 to July 2026, or -208,000 on an annually basis. While still negative, those values are closer to the bureau’s modest positive projection for 2026. Second, the Census Bureau’s estimate of NIM for 2024 (2.7 million) and its projection for 2026 of 321,000 show the government believes NIM can indeed swing widely. Third, the bureau’s projection was issued in January 2026 and is based on older information. Still, the level of net migration implied by our analysis of the CPS is large and negative, so it is legitimate to question the plausibility of such a large change. That said, immigration policy has never shifted so abruptly in such a short period of time from very permissive to much more restricted than it has in recent years. In the next section we look at the role of increased immigration enforcement in causing emigration.
Deportations Have Risen Dramatically. Removals by DHS are an important component of emigration. There is no question there has been a large increase in interior removals, but it is difficult to precisely quantify because of the way the data is released. Interior enforcement is what matters when considering the decline in the number of immigrants in the CPS because only those who have settled in the country would show up in the survey. Removals for those who are arrested at the border have nothing to do with the emigration of those already in the country.
The Detention Management website run by ICE, which has primary responsibility for interior enforcement, shows removals by ICE from January 2025 to July 2026 were roughly 260,000 more than in the same period in the prior two years.22 However, some share of these ICE removals were transferred from the Border Patrol and are not interior removals. Of course, that was true in prior years as well. At UCLA’s Deportation Data Project more detailed removal data is available.23 Using the data project, the number of interior removals more than tripled, increasing by roughly 207,000, in the first part of Trump’s second term compared to the last part of Biden’s term.
Further, Stateline’s analysis of information provided by the Deportation Data Project found the number of voluntary departures in the first 16 months of the Trump administration were 89,494 compared to 11,977 in the last 16 months of the Biden administration, though some of these departures were at the border.24 Taken together, the number of people who left the country from the interior related to some kind of enforcement act was roughly 350,000 larger in the first part of the Trump administration than in the last part of the Biden administration. This contributed significantly to higher emigration levels that show up in the CPS numbers. A large increase in interior removals also created the incentive for more illegal immigrants to leave on their own out of concern that they would run afoul of the law. However, based on the data available, interior removals and voluntary departures could not by themselves account for the higher levels of emigration implied by the CPS. Voluntary emigration would have to have increased substantially for the foreign-born population to decline this much.
Conclusion
The government’s household survey, formally known as the Current Population Survey (CPS), shows an unprecedented decline in the foreign-born population of 2.9 million from January 2025 to July 2026. This represents a profound reversal compared to an increase of 8.3 million from January 2021 to January 2025 during the Biden border surge. Both administrative data and the CPS indicate that the number of people settling in the county legally and illegally has fallen significantly, while the number leaving has increased dramatically. In fact, our analysis shows net migration to the United States has turned negative since January 2025 for the first time since the 1930s. The decline in the foreign-born is entirely among Latin American non-citizens who indicated they arrived in 1980 or later, a population that overlaps significantly with illegal immigrants.
Although not all of the administrative data is available to estimate the illegal immigrant population, we preliminarily estimate based on the information available that the illegal immigrant population may have declined 2.3 million since January 2025. This, too, represents a profound reversal in the size of the illegal immigrant population, which we estimate had grown by 5.6 million from the start of 2021 to the start of 2025. This decline was due to both a fall-off in the number of new arrivals, a significant increase in interior removals by ICE, and voluntary emigration.
Employers and those who advocate for them may worry that the huge decline in immigrants will have a large impact on the economy. However, only 44 percent of the decline in immigrants is among workers. This fact, along with employment gains by the U.S.-born mitigates the impact on the job market and may help explain why the survey of businesses that measures jobs has not shown a dramatic decline in workers.
There are reasons for caution in interpreting the decline in the foreign-born population. First, it is difficult to determine the extent to which immigration enforcement is impacting immigrants’ willingness to take part in the CPS. Second, although interior removals have increased dramatically, the decline in the number of immigrants observed in the survey would still require an unprecedented increase in voluntary emigration. Finally, the CPS has a large margin of error, which should be kept in mind.
The bottom line is that the household survey shows a huge decline in the foreign-born, which seems to be due primarily to a dramatic decrease in the number of illegal immigrants in the country. We find no evidence that the foreign-born are claiming to be U.S.-born or that non-citizens are claiming to be naturalized citizens in the survey. Further there is no correlation in response rates to the survey and the size of the foreign-born population, which we would expect if immigrants were still in the country but refusing to take part in the survey. We have no evidence that immigrants are not responding to the CPS. But even if half of the decline in the overall foreign-born population or in the illegal immigrant population is due to an increased unwillingness on their part to participate in the survey, it would still be the case that the actual fall-off in their numbers is very large and could reasonably be described as unprecedented.

No comments:
Post a Comment
Note: Only a member of this blog may post a comment.